Steve Cotter
Hi. I'm Steve.
I live and work in Pittsburgh. I enjoy building things, analyzing things, and knowing things. Below is a sample of my recent work.
Kittens and Puptens
A simple and free app for practicing adding to ten, co-designed by my five-year-old daughter.
Swift, React.js
GoBoost Platform
A web platform for brands and small business to get online with custom websites, reviews, and ads. Includes a WYSIWYG site builder, extensible collections - basically a hierarchical Wix for brands. This site, along with thousands of others, is built and served by GoBoost.
Python, React.js, Node.js

TerraRunner
A mapping and data-visualization-focused run tracker for iOS.
Swift, Vue.js, D3.js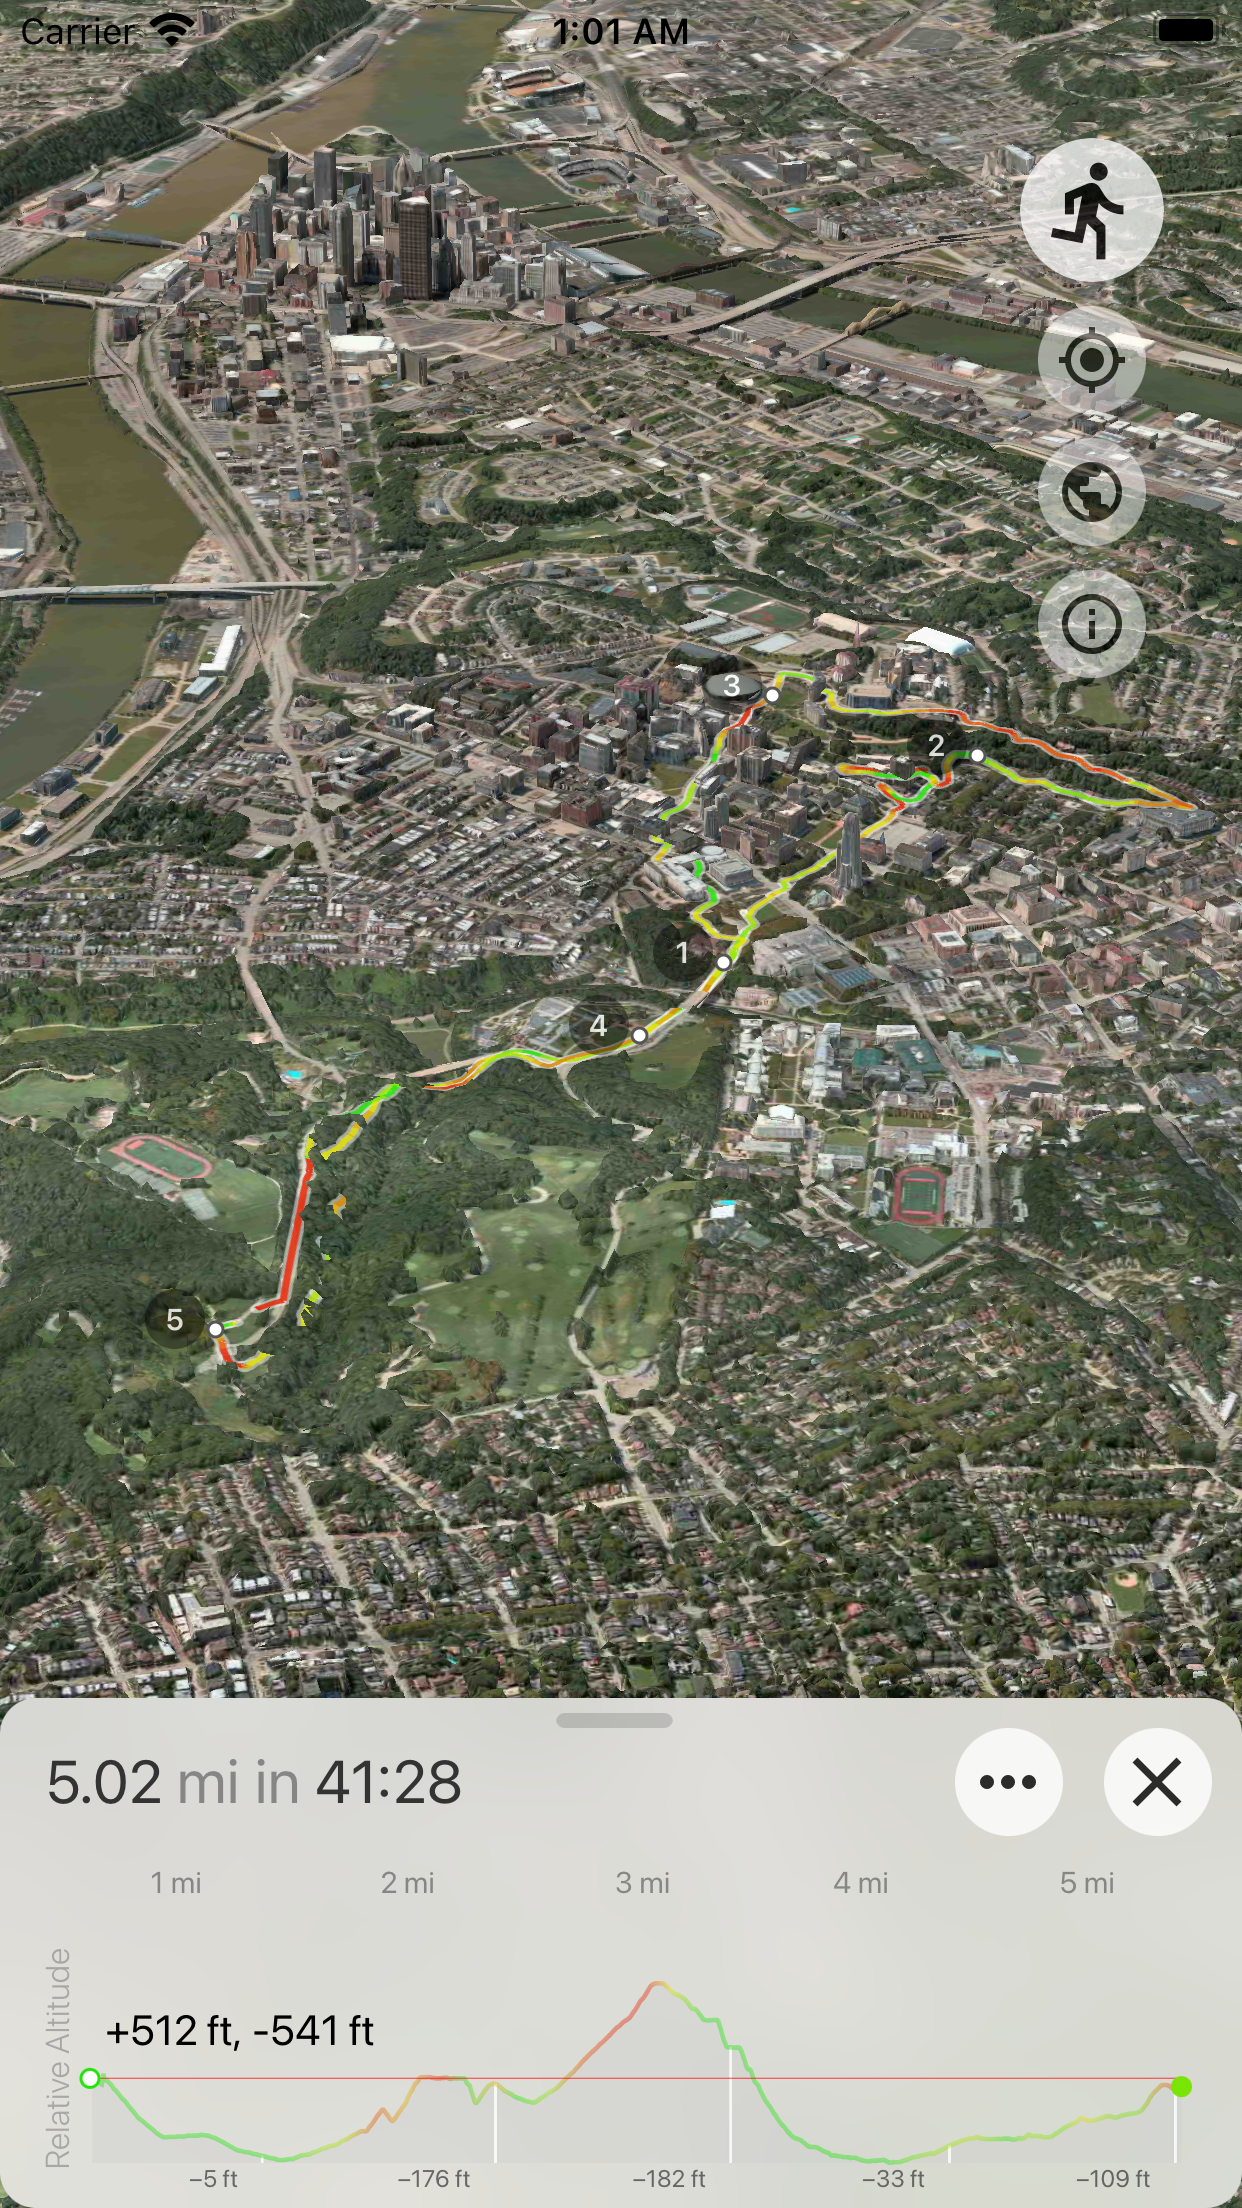


React Pad
A React and JavaScript coding playground for macOS and iOS.
Swift, Vue.js, D3.js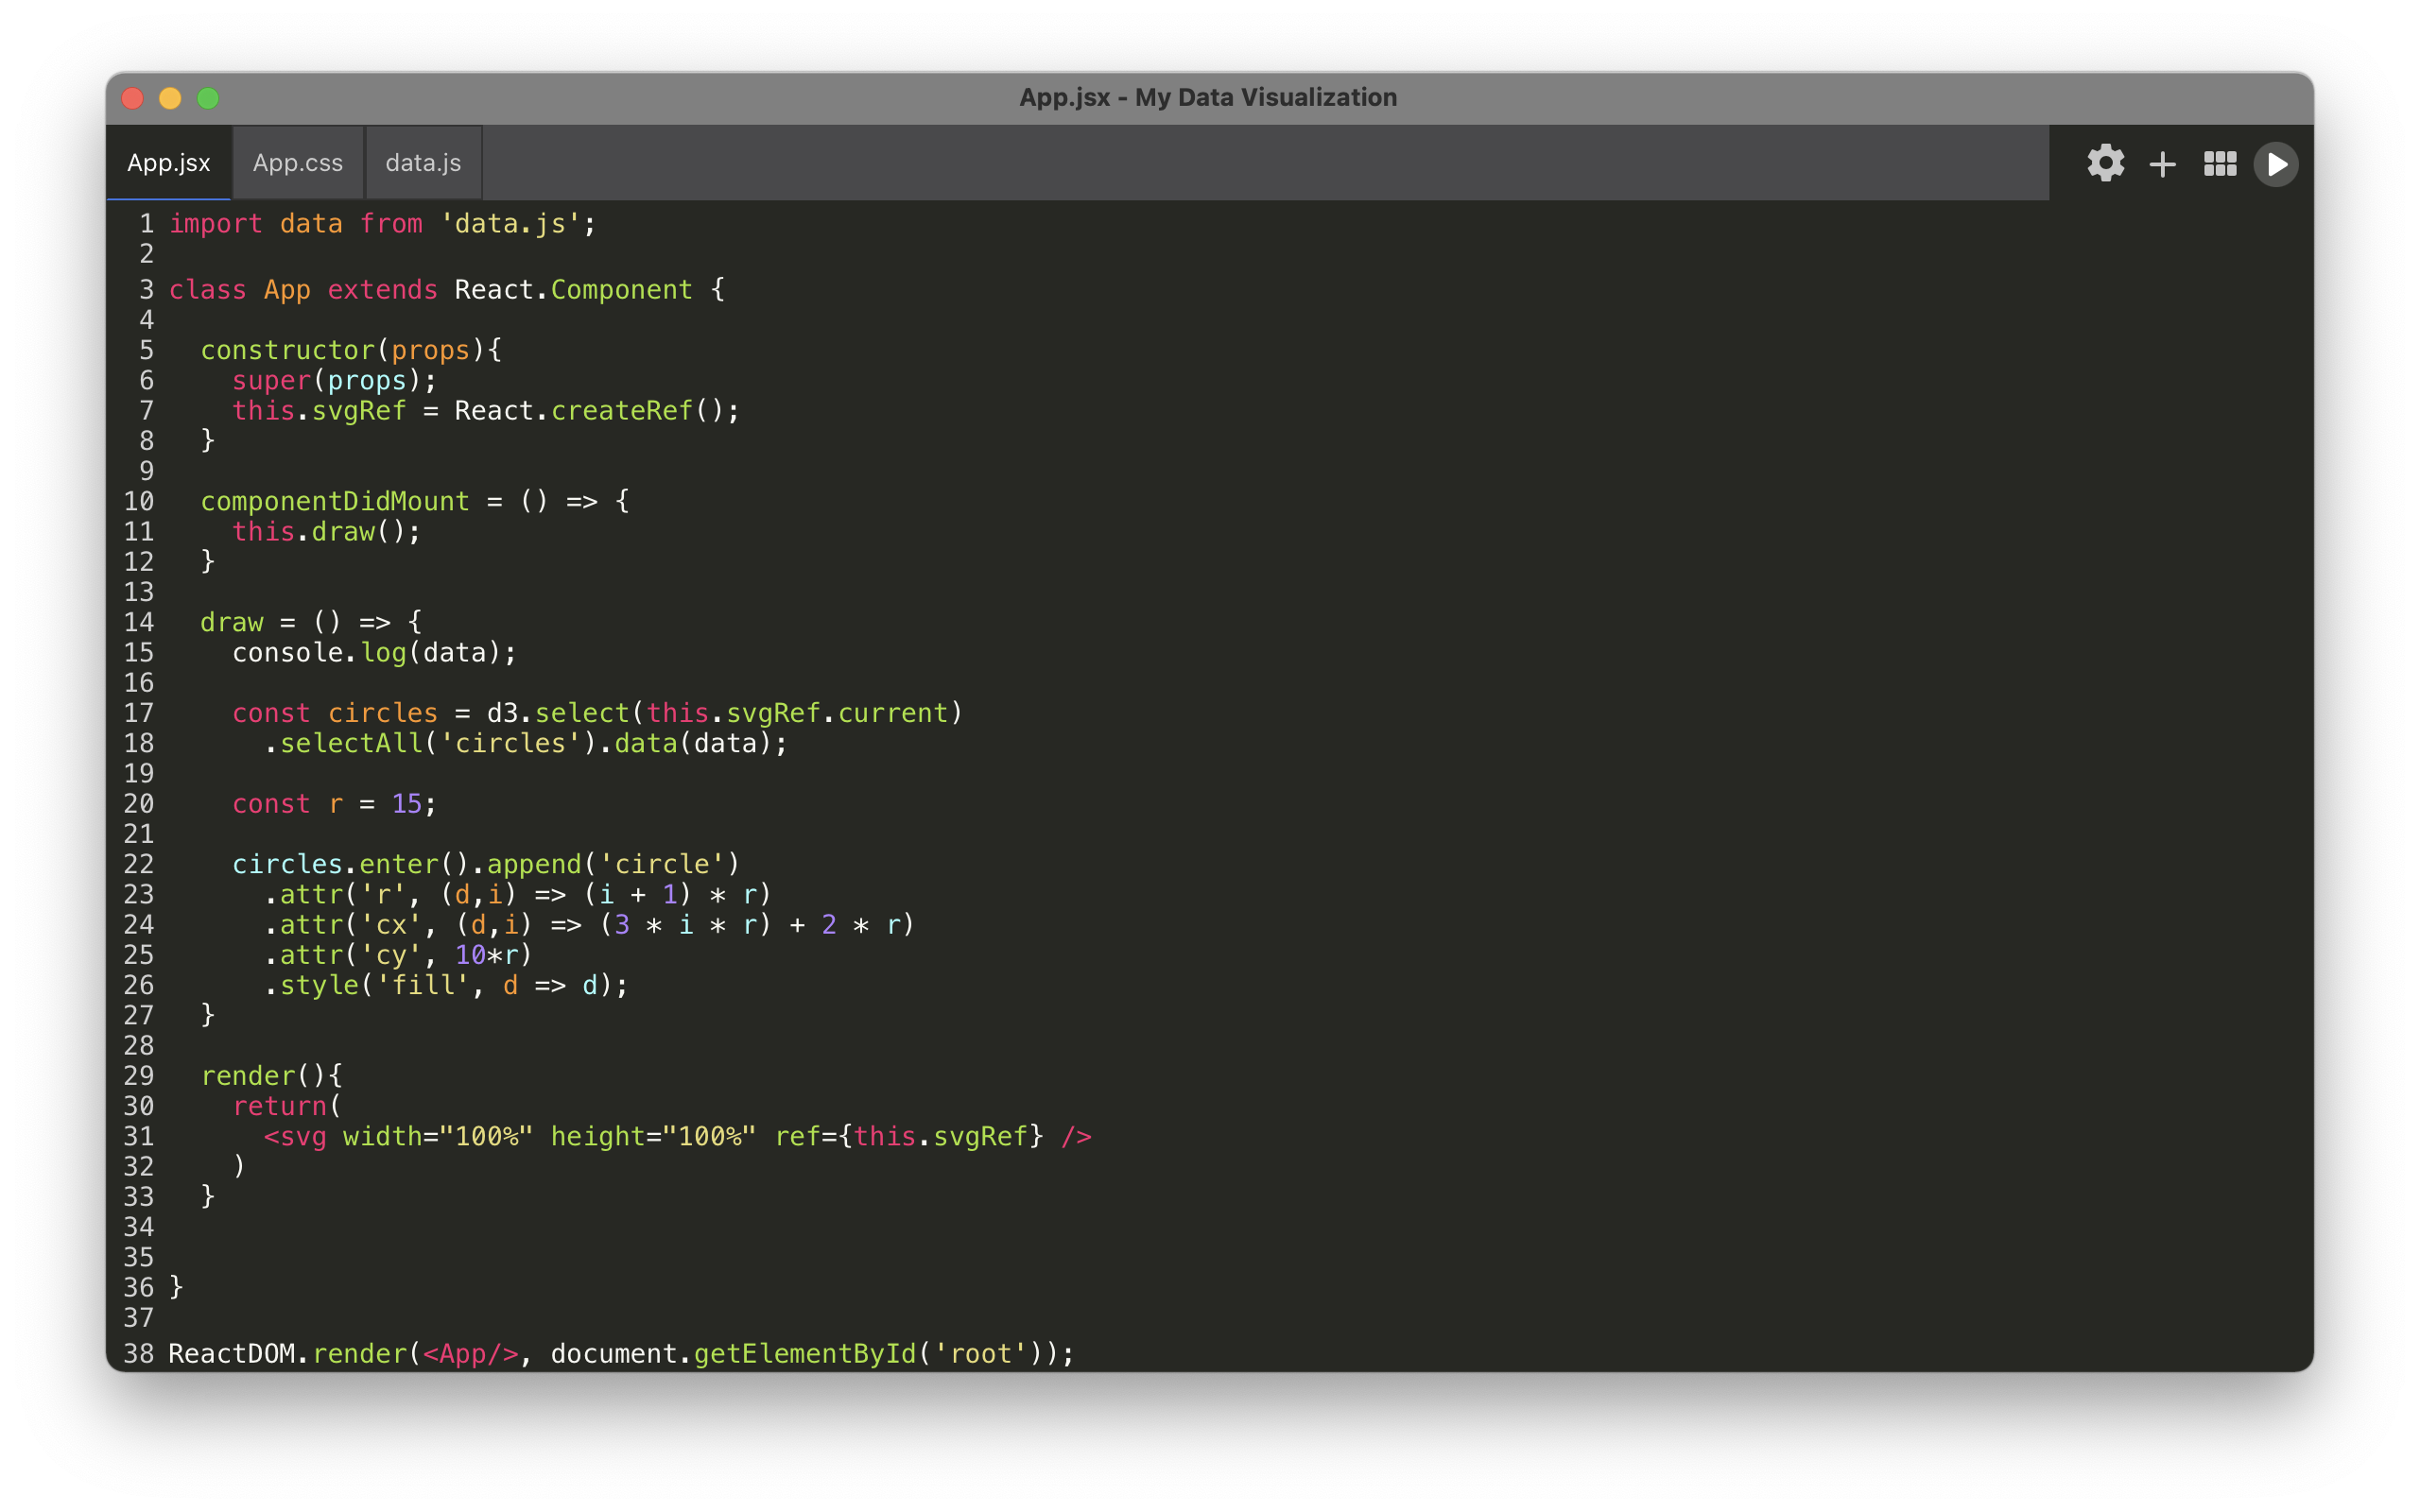


Stop Mapping Counties, Start Mapping Exposure
At what point does public health supercede individual privacy?
Medium Article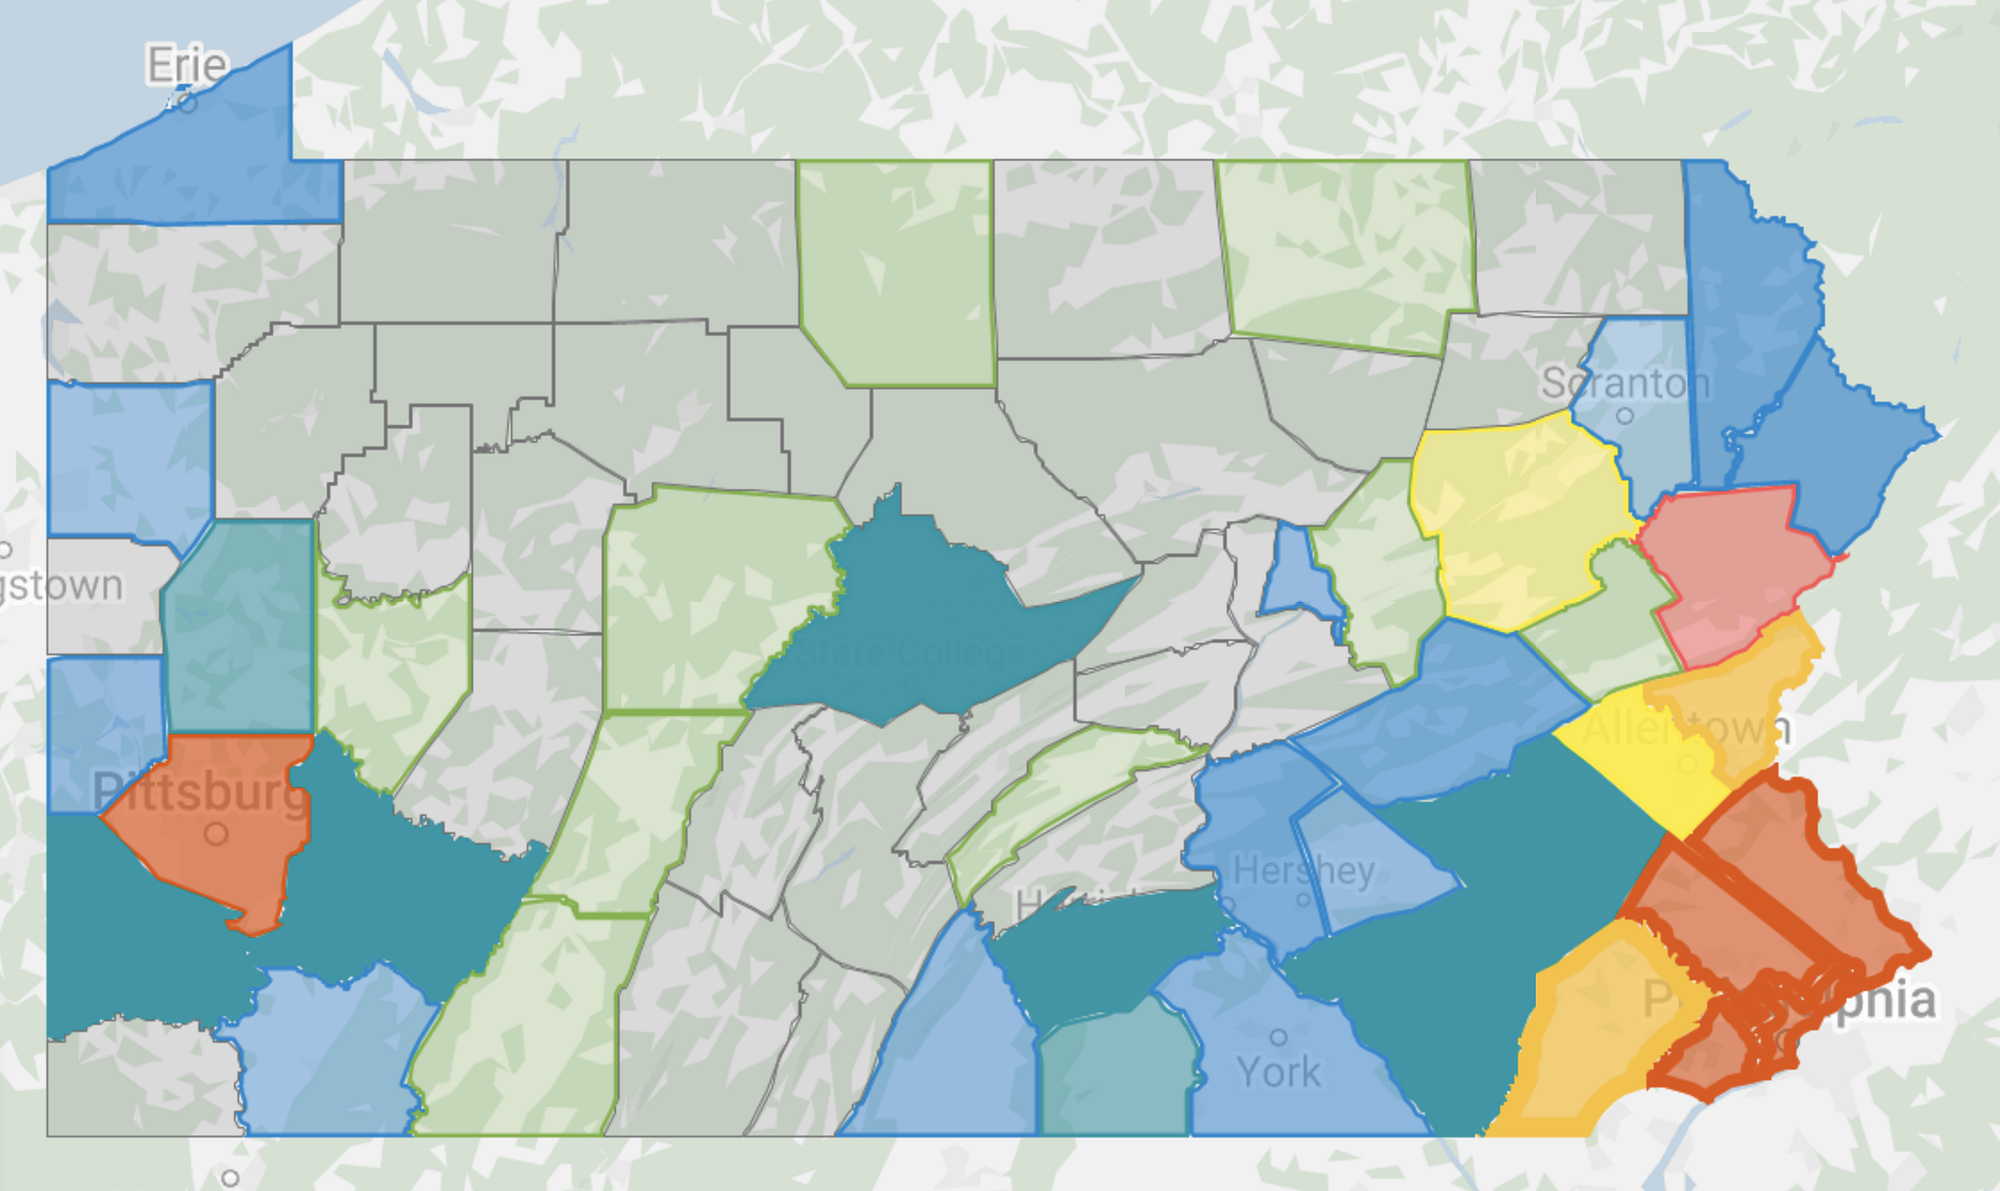
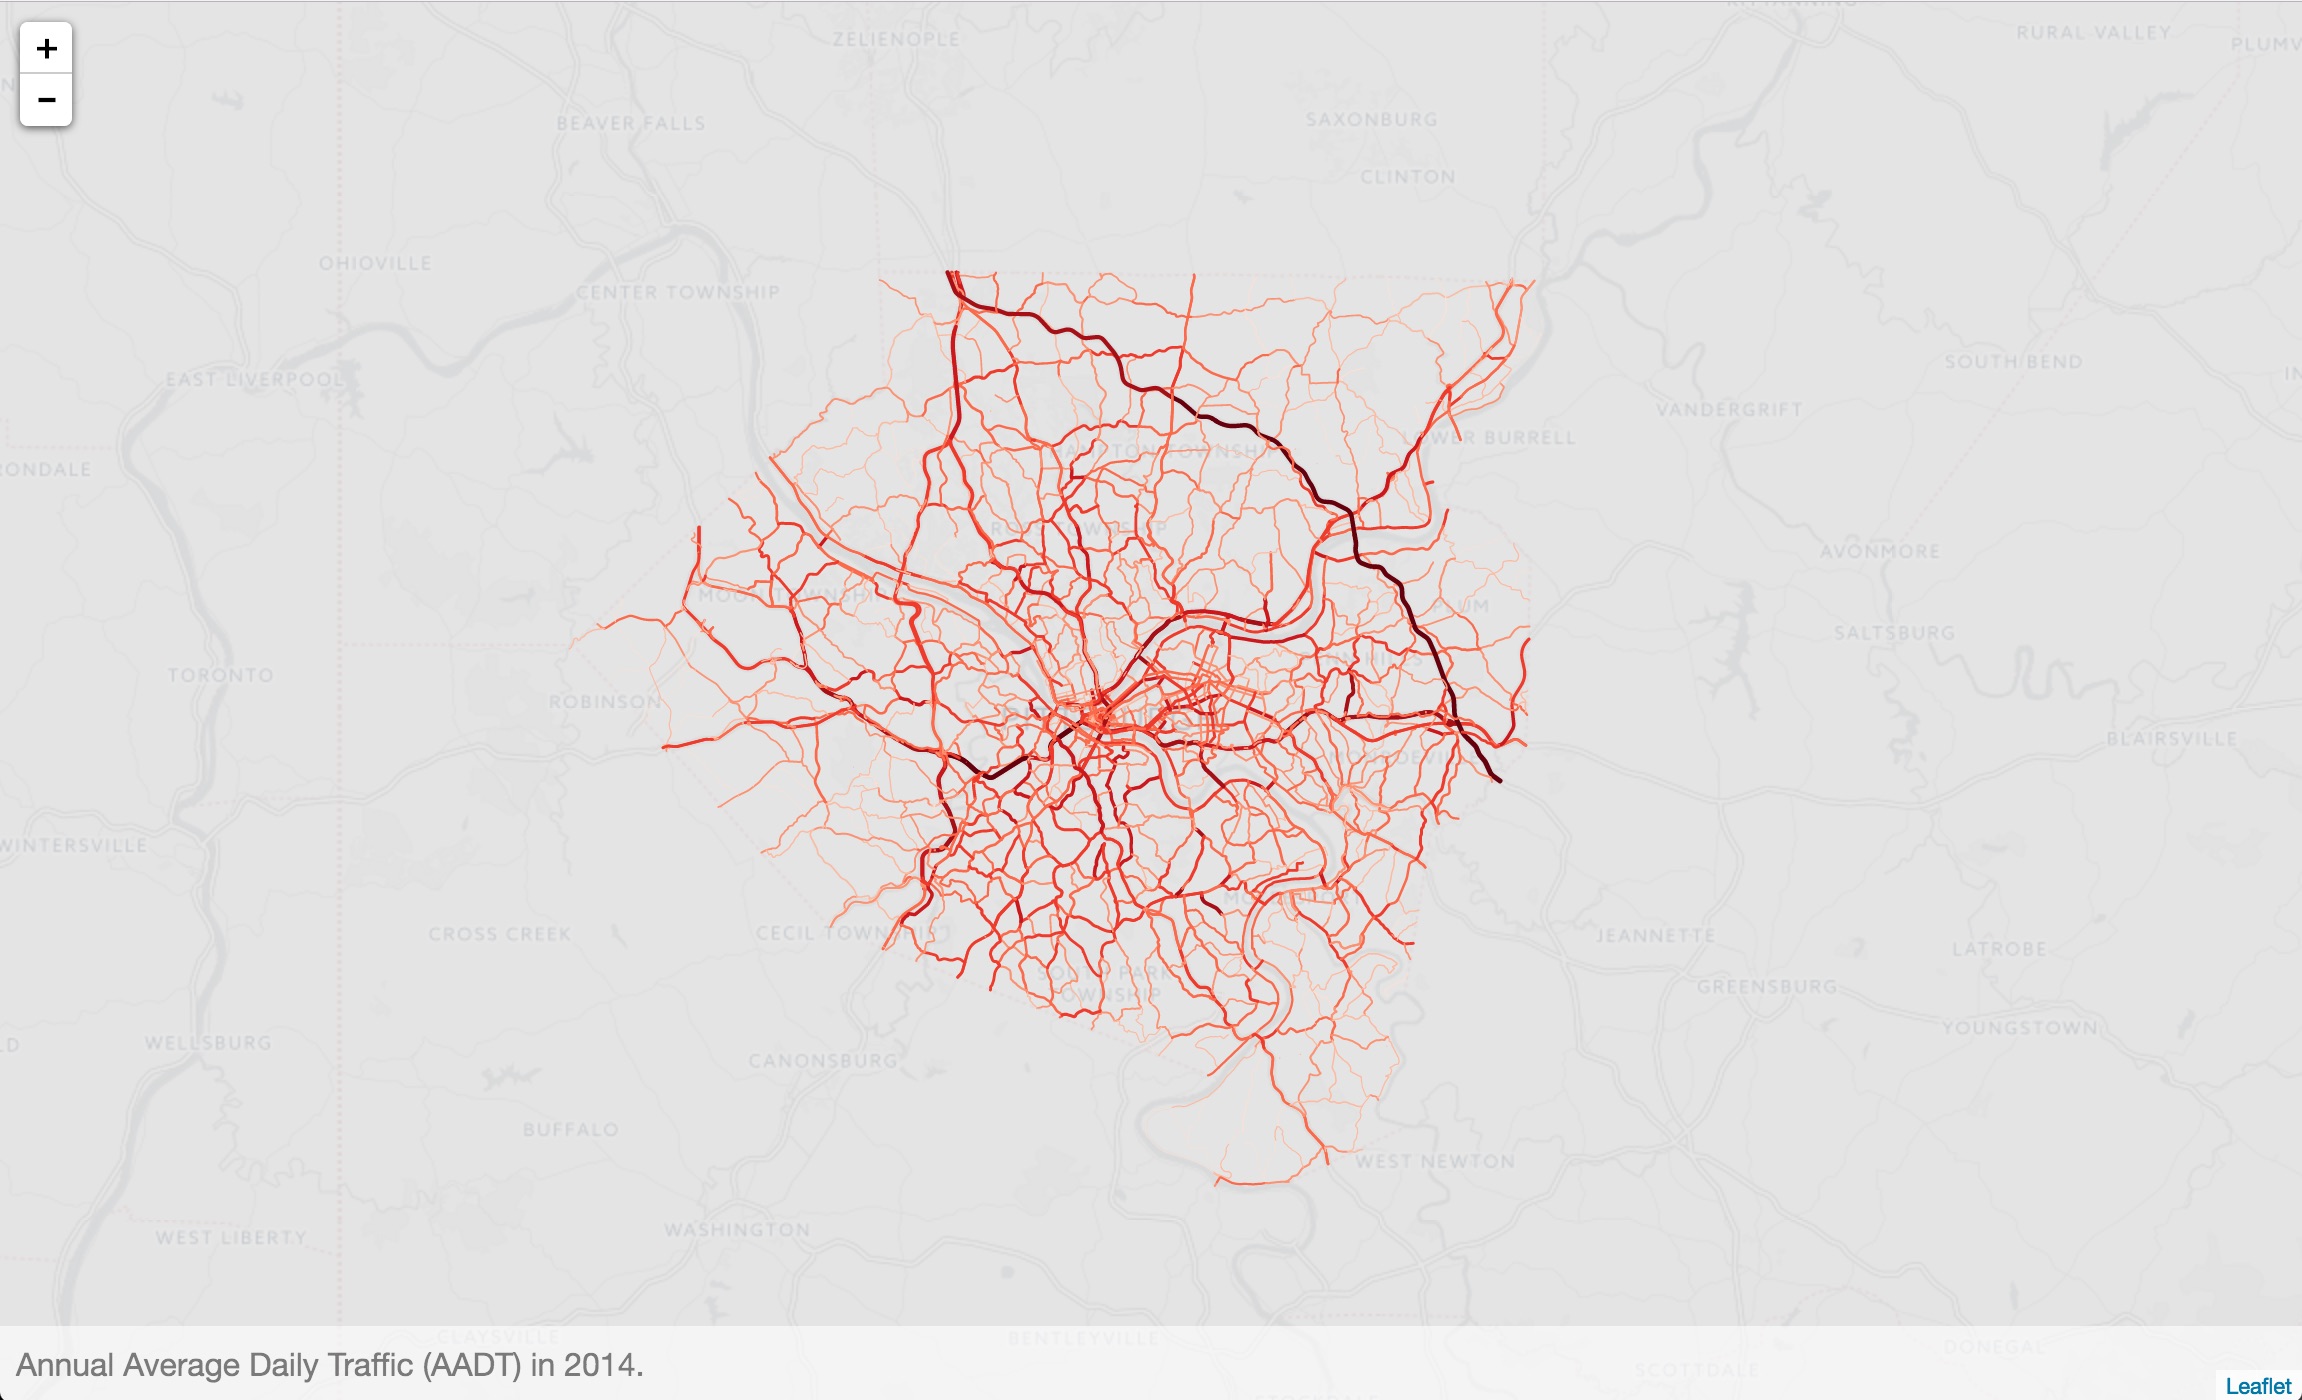
A Quarter-of-a-Million Healthy Rides
Medium ArticleVisualization and Spectral Clustering of Bike-Share rides in Pittsburgh, PA.
PostgreSQL, PostGIS, Leaflet, D3.js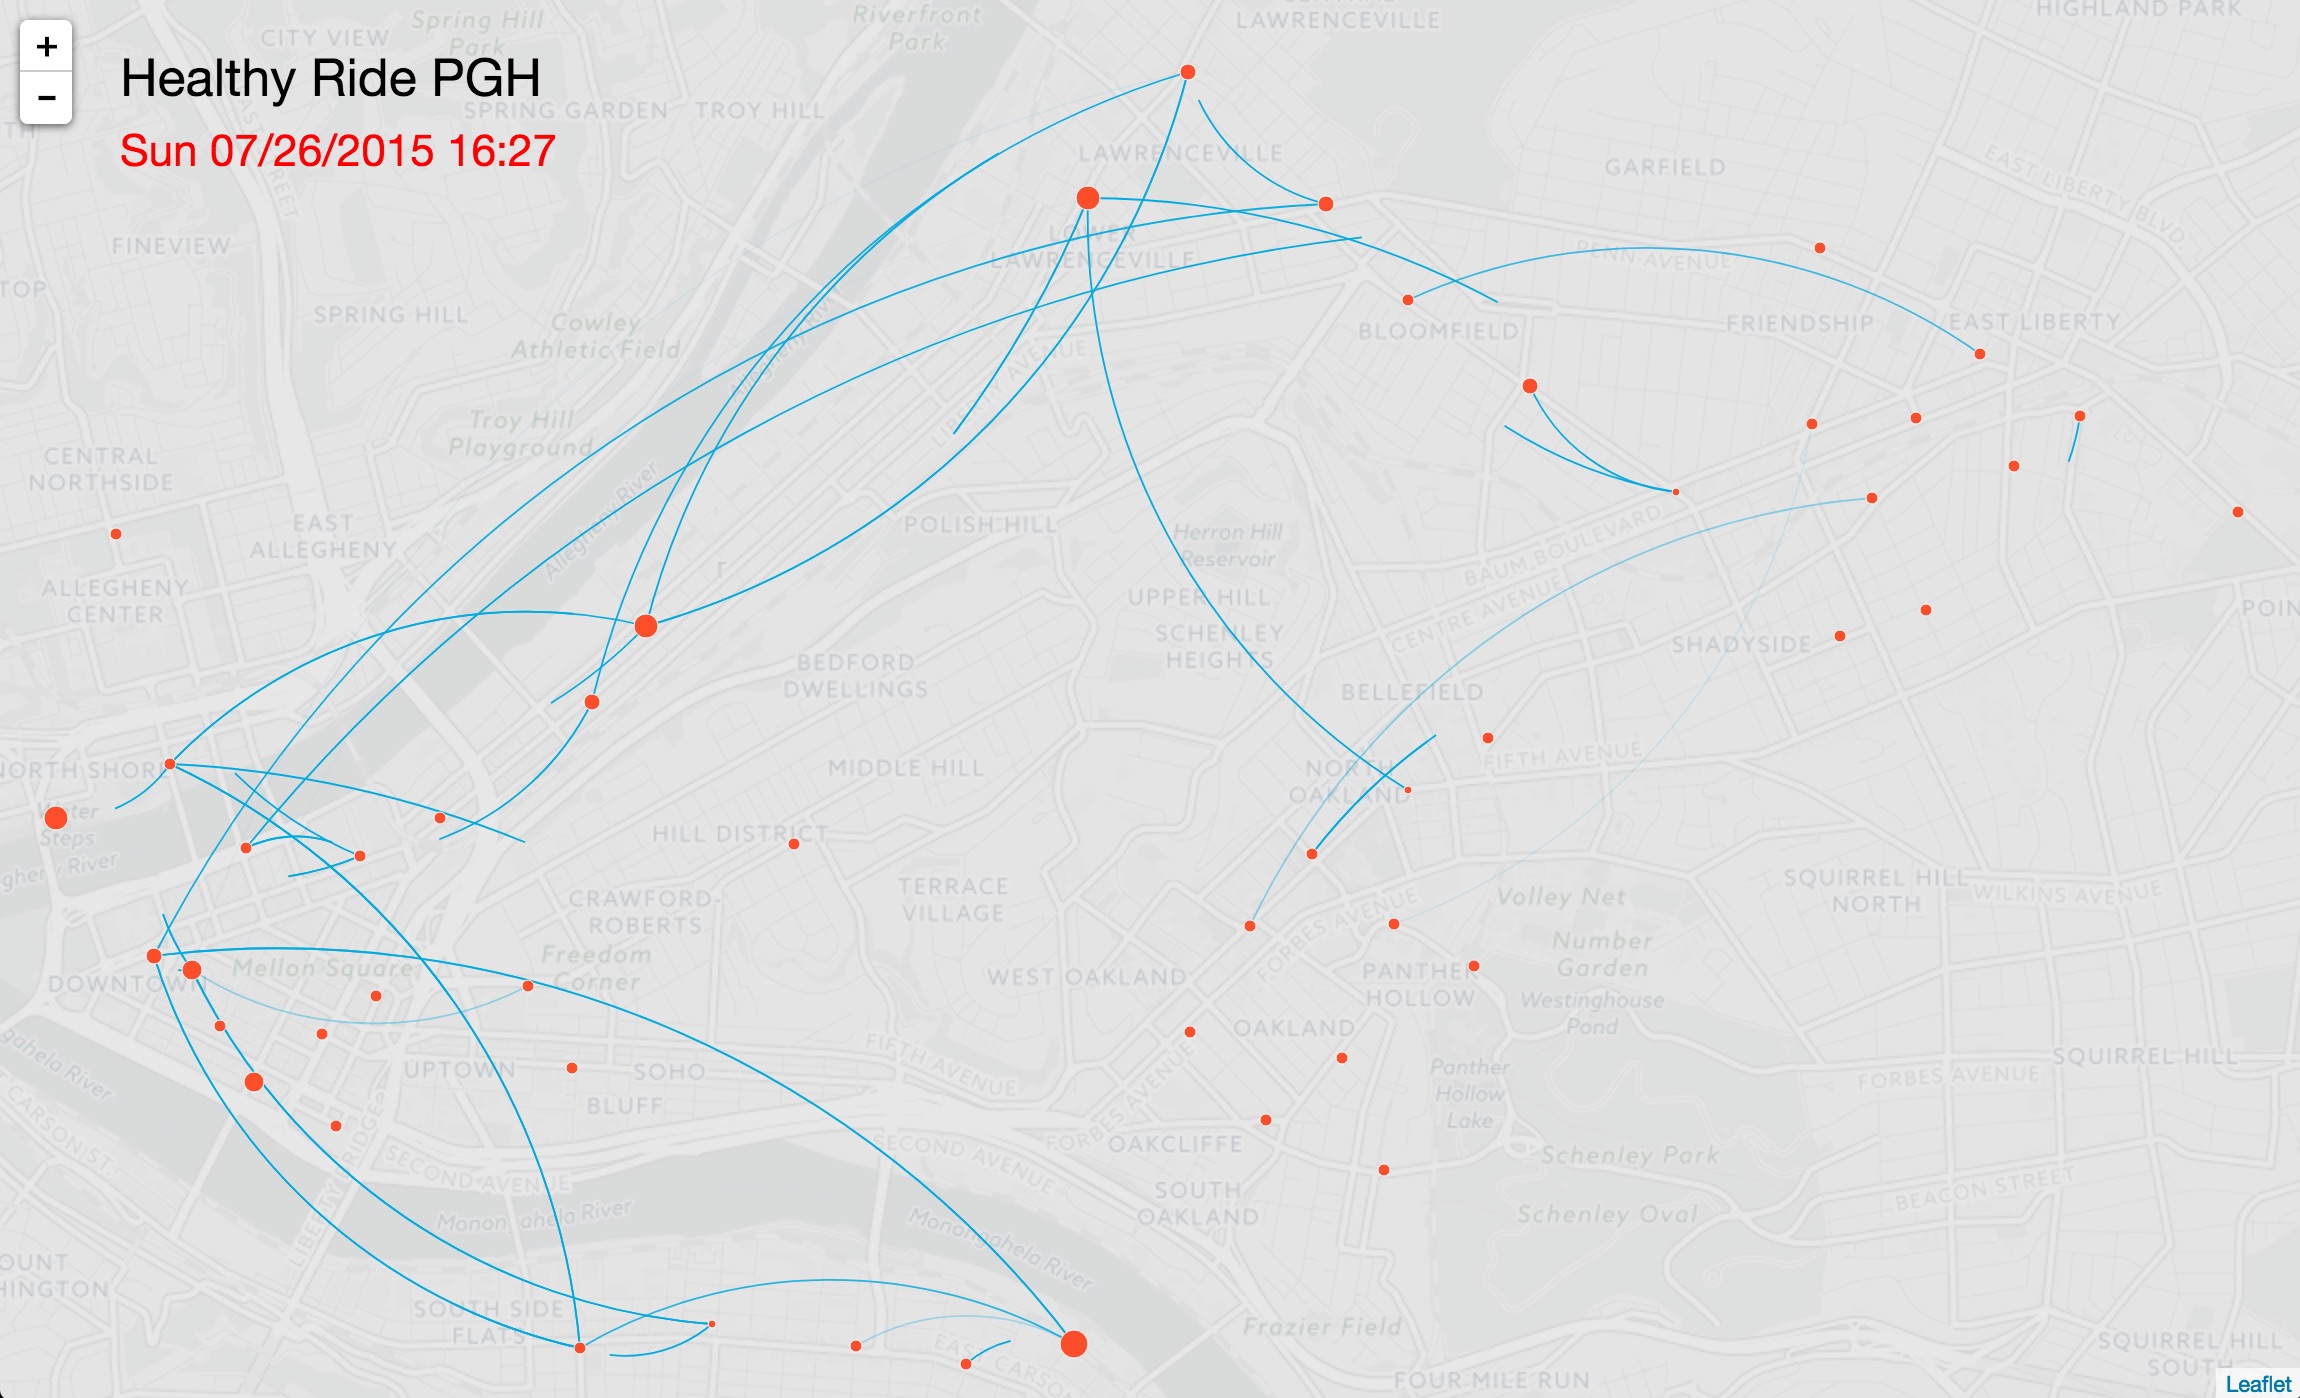
Hate Hits Home
Smaller cities like Pittsburgh often enjoy national and international media attention. But not like this.
Medium Article
“Machine Learning” should be called “Blind Optimization”
The way we anthropomorphize optimization algorithms as “intelligent” systems that “learn” and “think” mystifies the public while degrading real human intelligence. Never mind the arrogance.
Medium ArticleVisualizing Pittsburgh Transit
Medium ArticleWhat do 6,500 public transit trip look like?
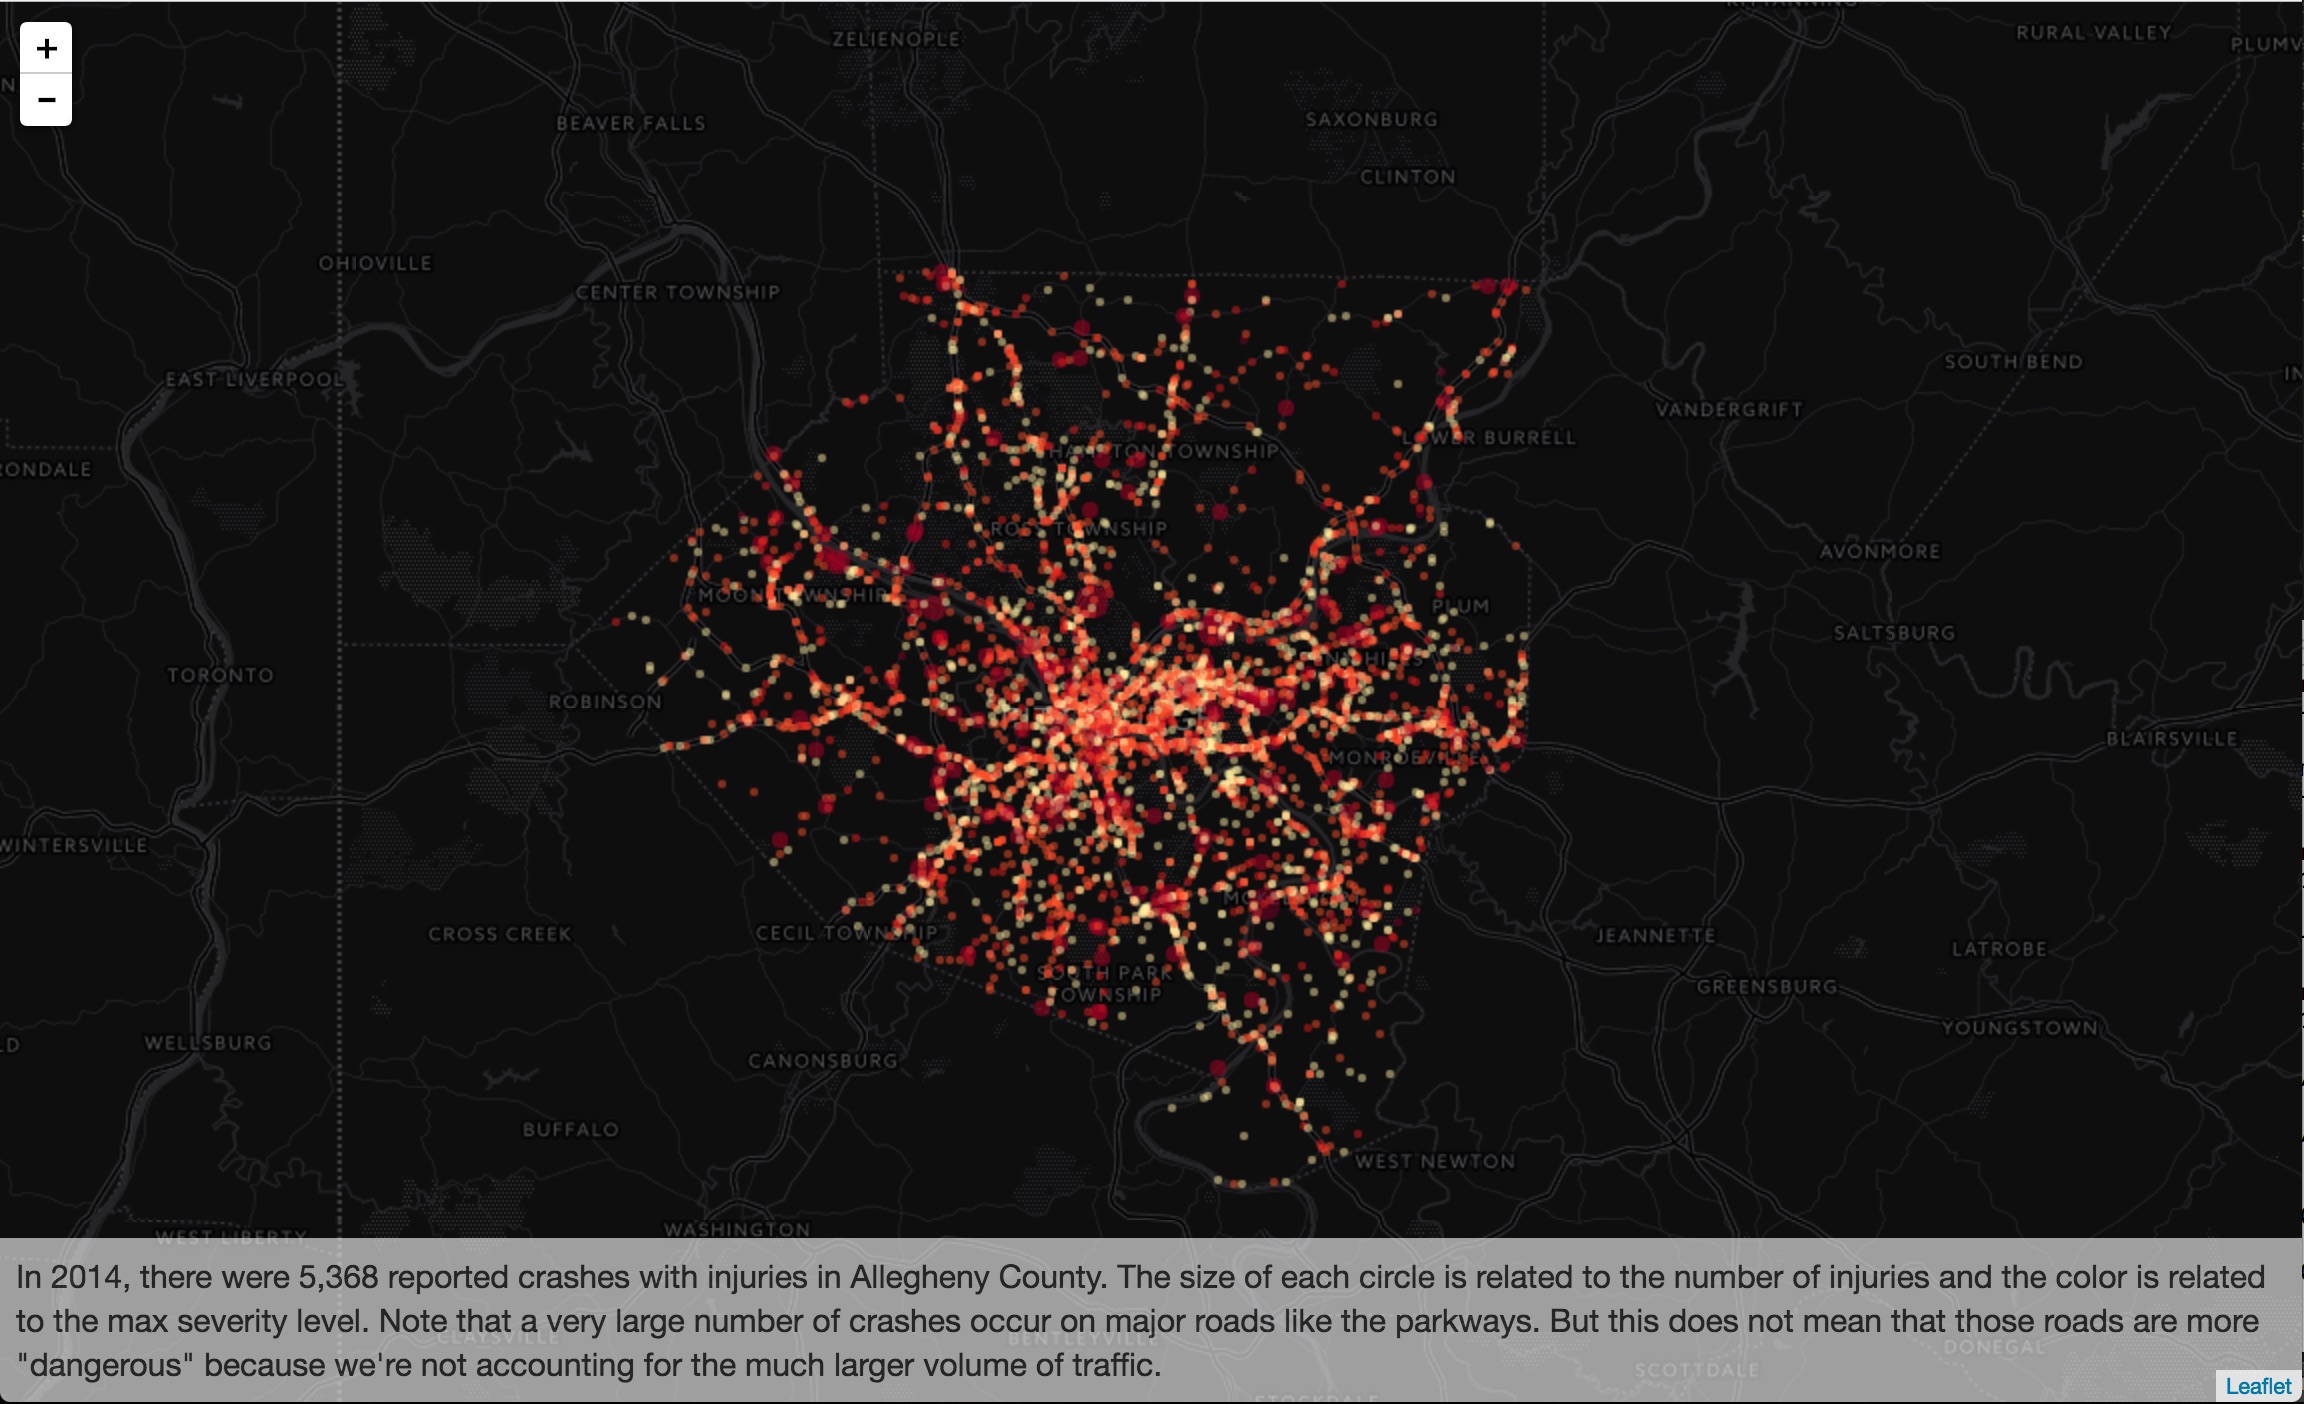
PostgreSQL, PostGIS, Ruby, D3.js, Leaflet, HTML5 CanvasCrashes
A visualization and analysis of Pittsburgh crash data.
PostgreSQL, PostGIS, Leaflet, R, D3.js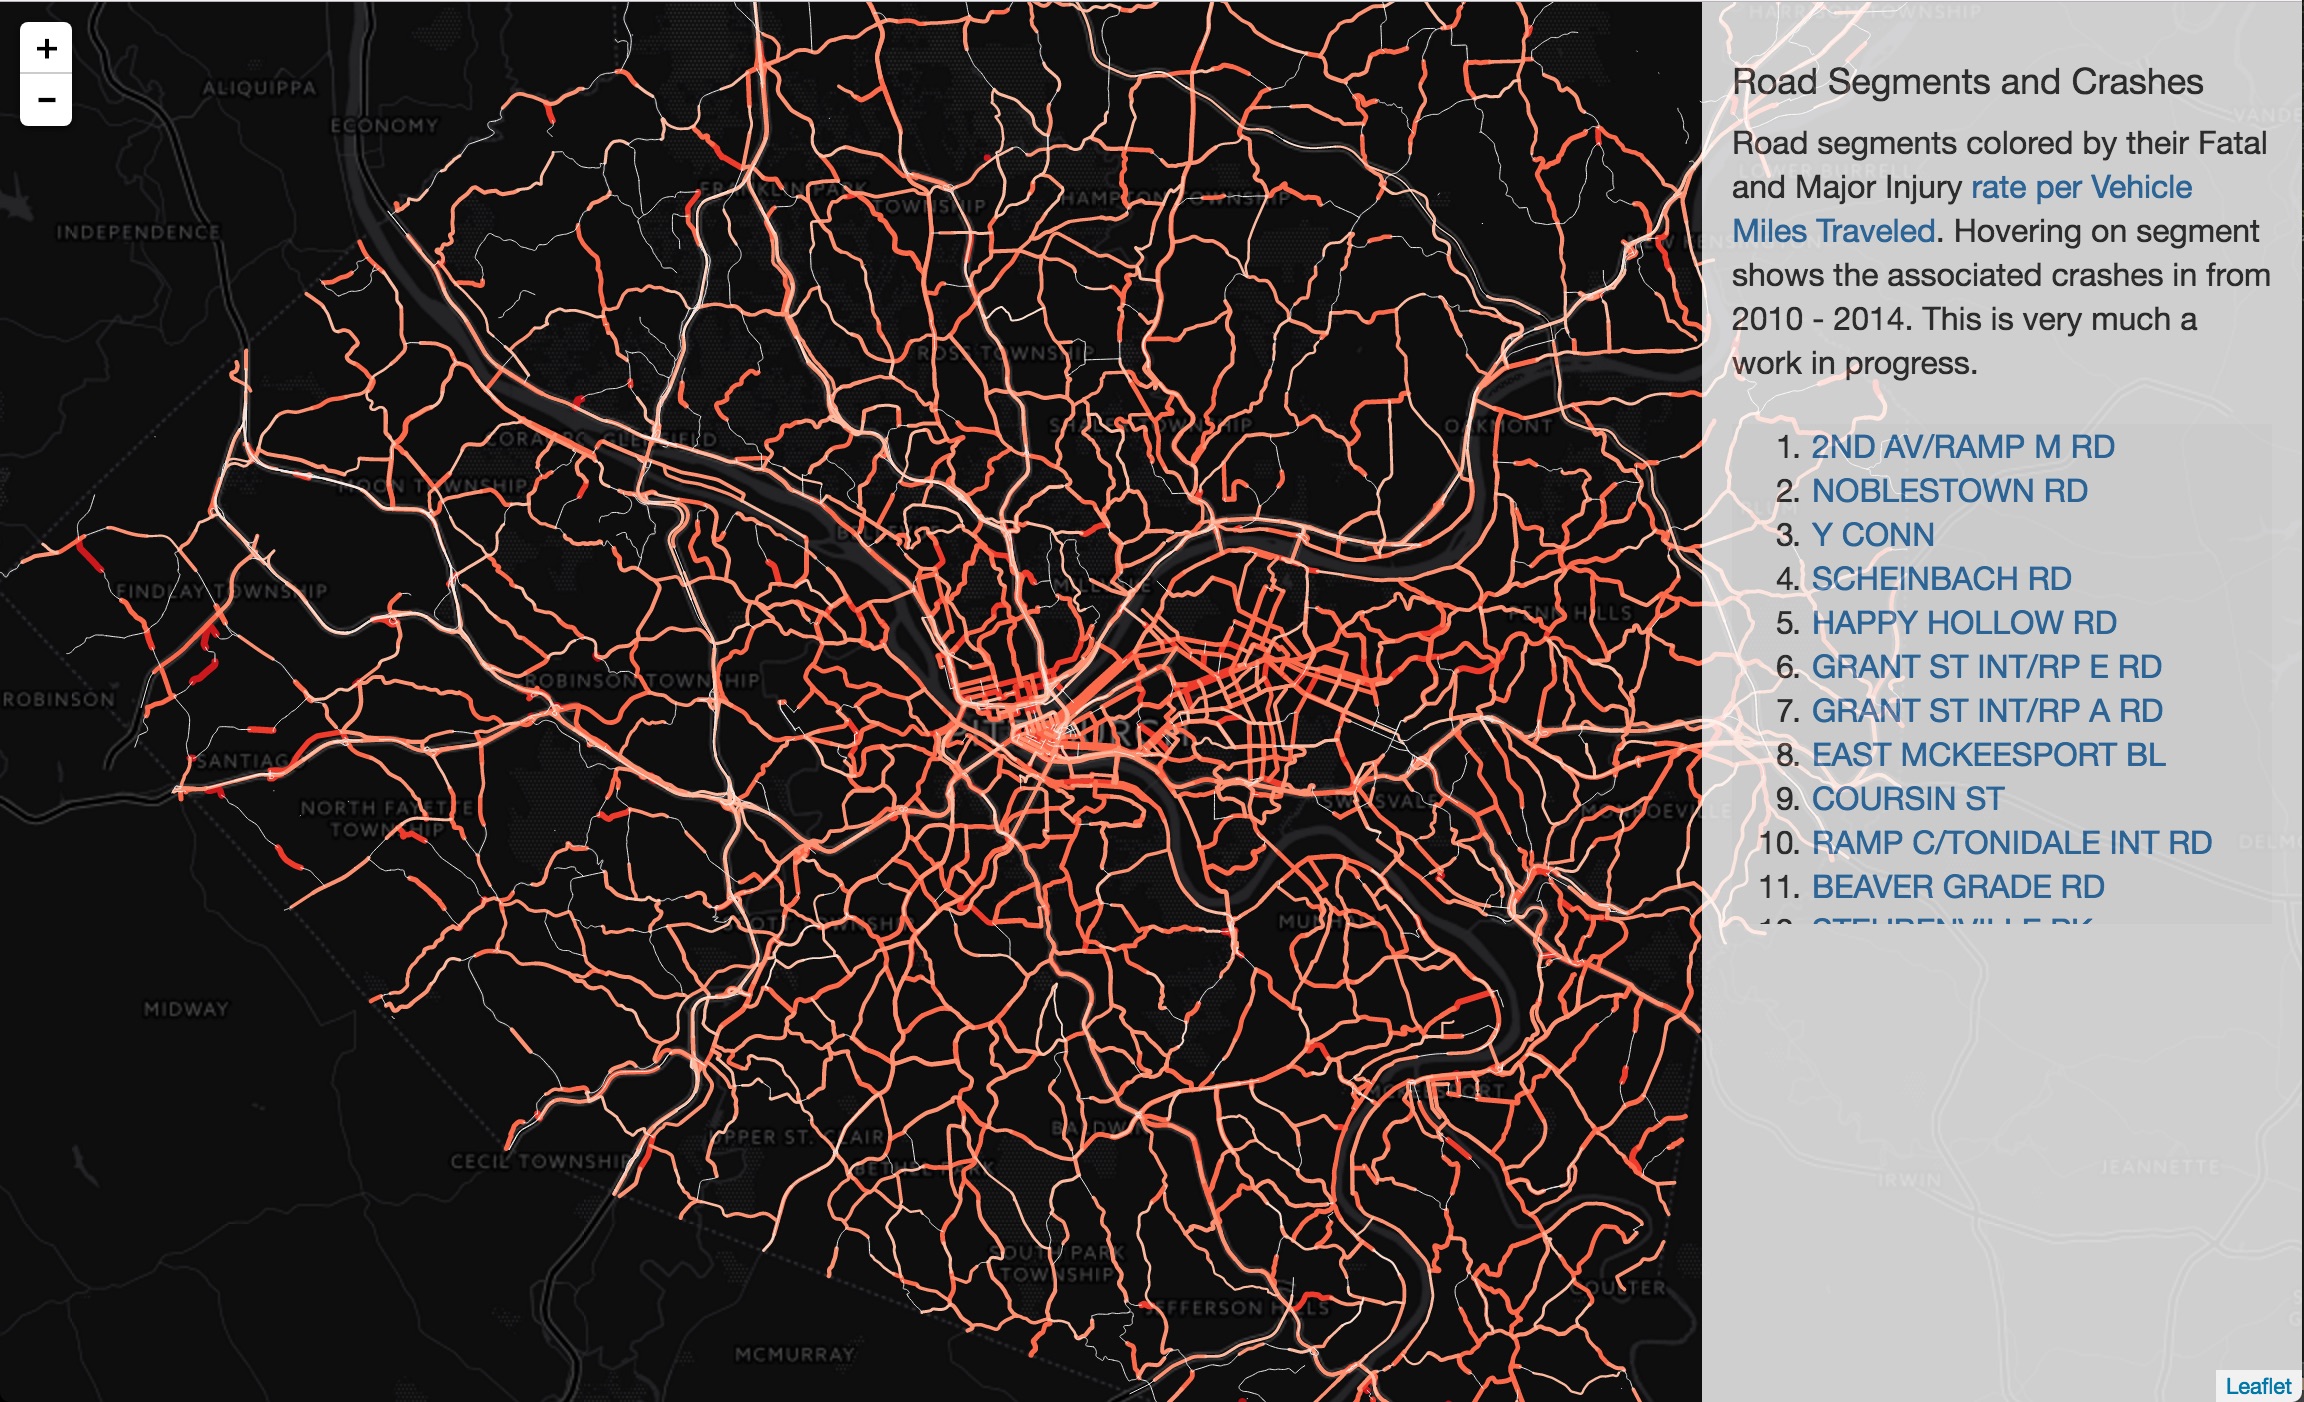
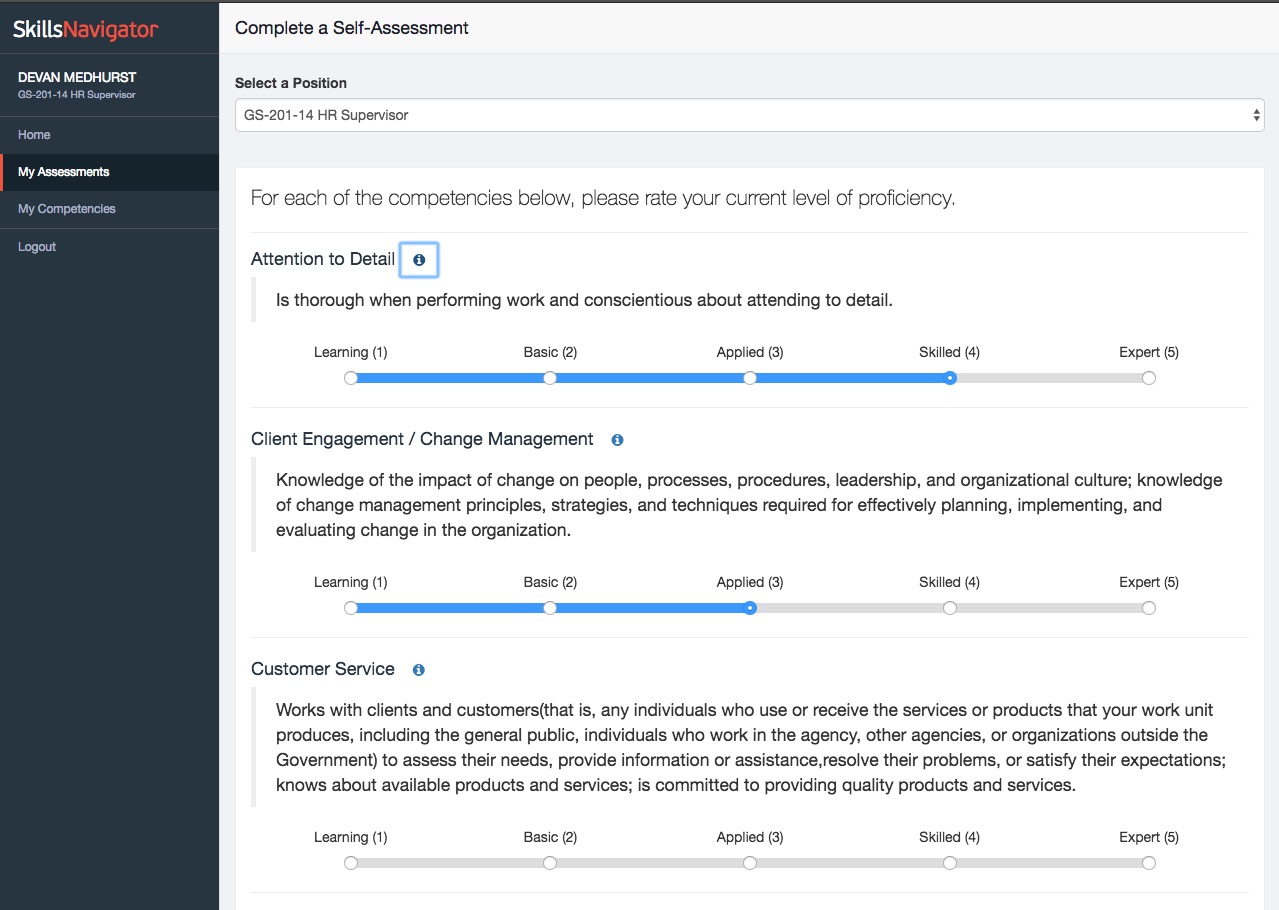
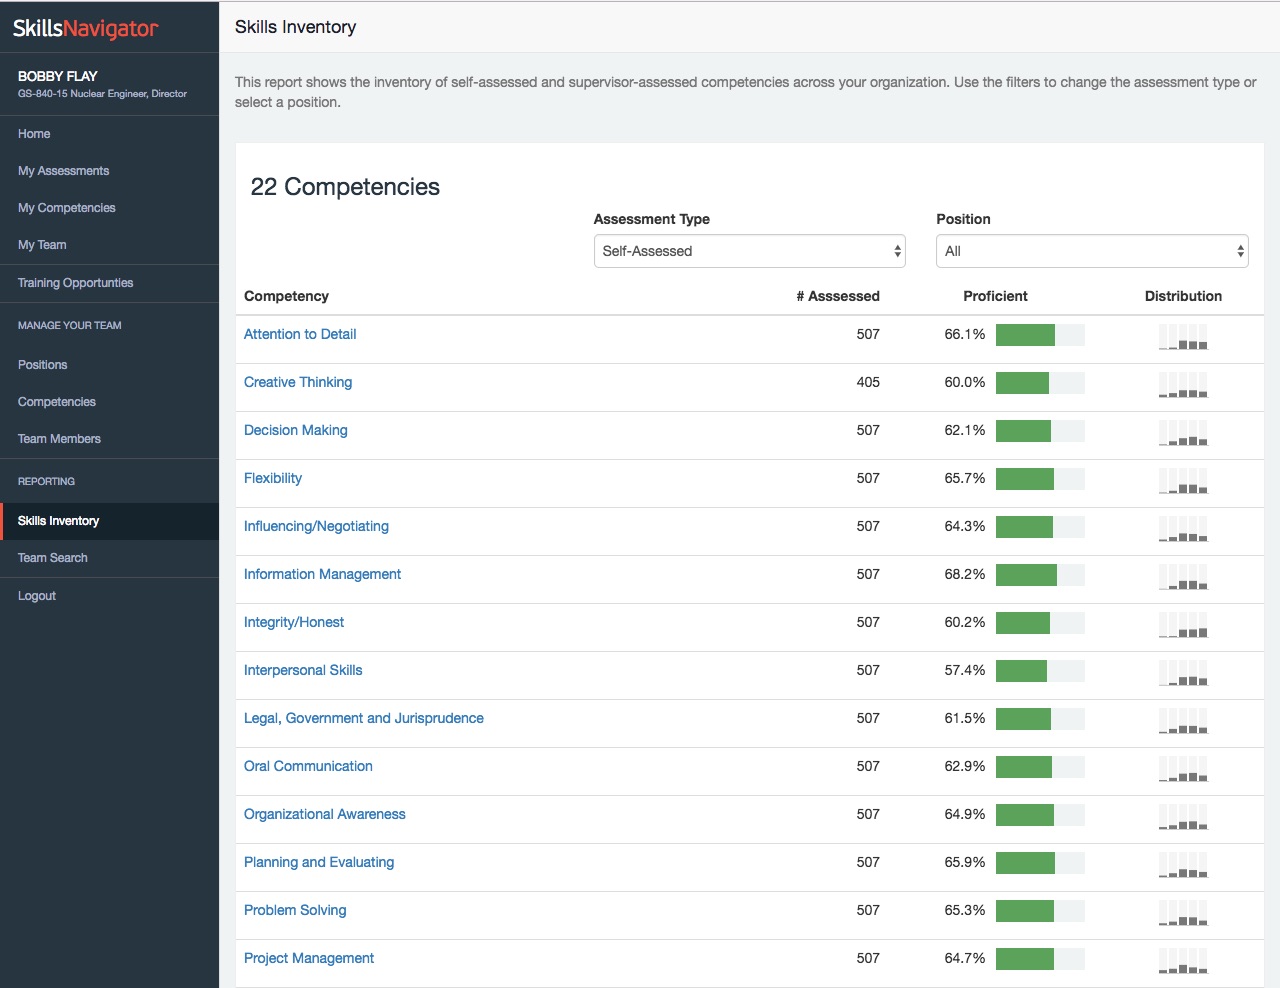
Skills Navigator
A competency assessment and reporting app. Users conduct self assessments, view their supervisors assessments of them, and track competencies over time.
Ruby, Rails, Vue.js, SVG, PostgreSQL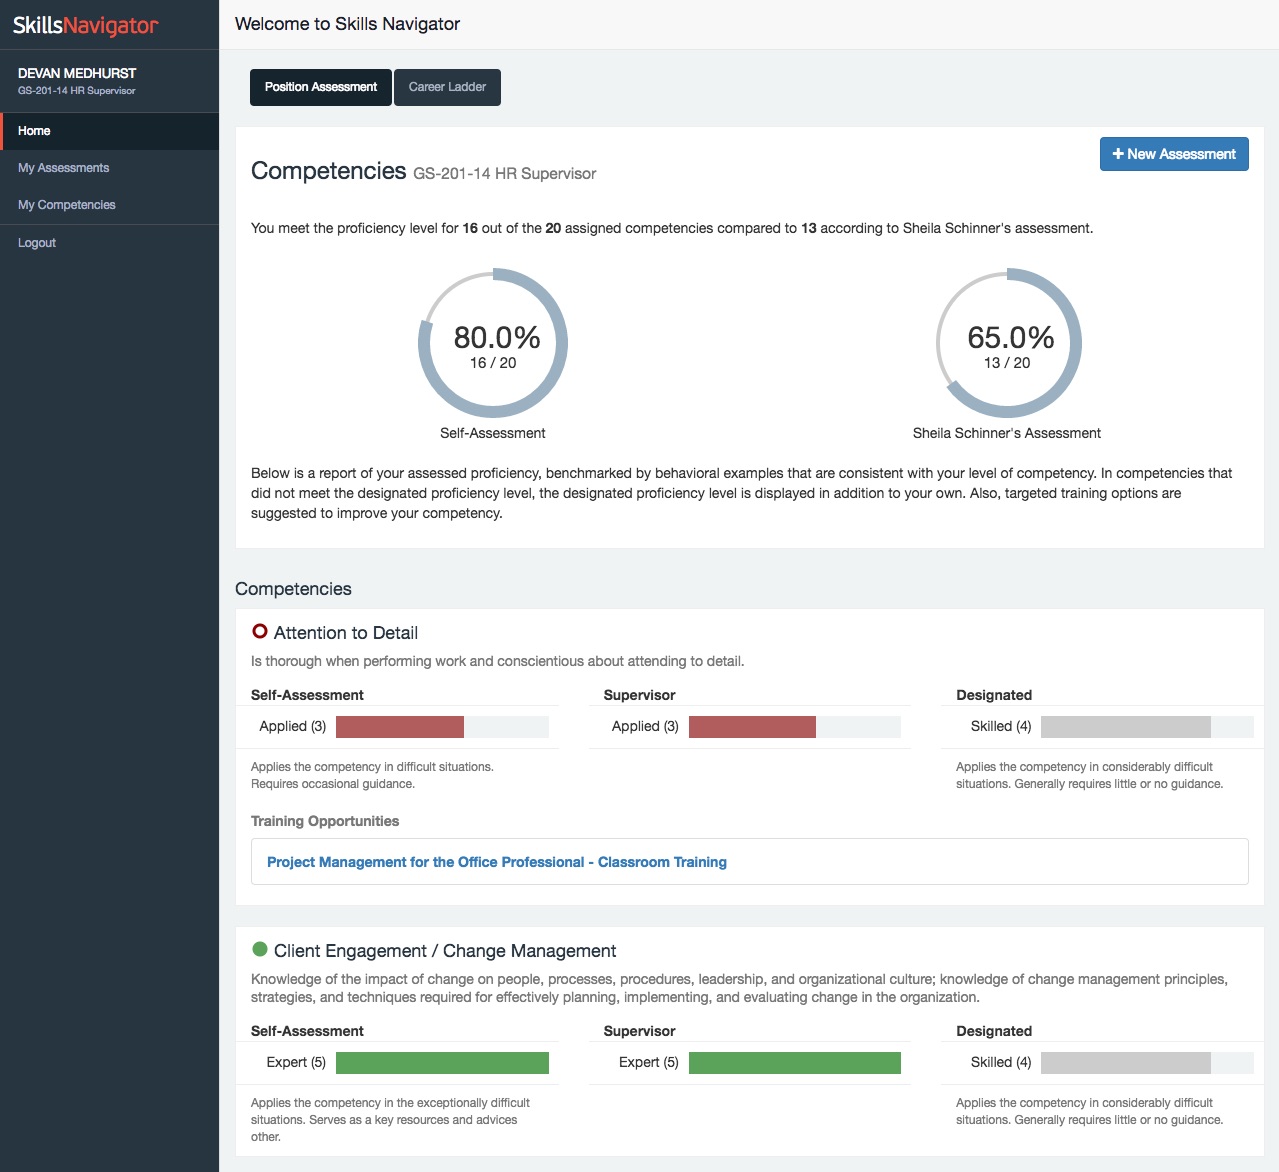
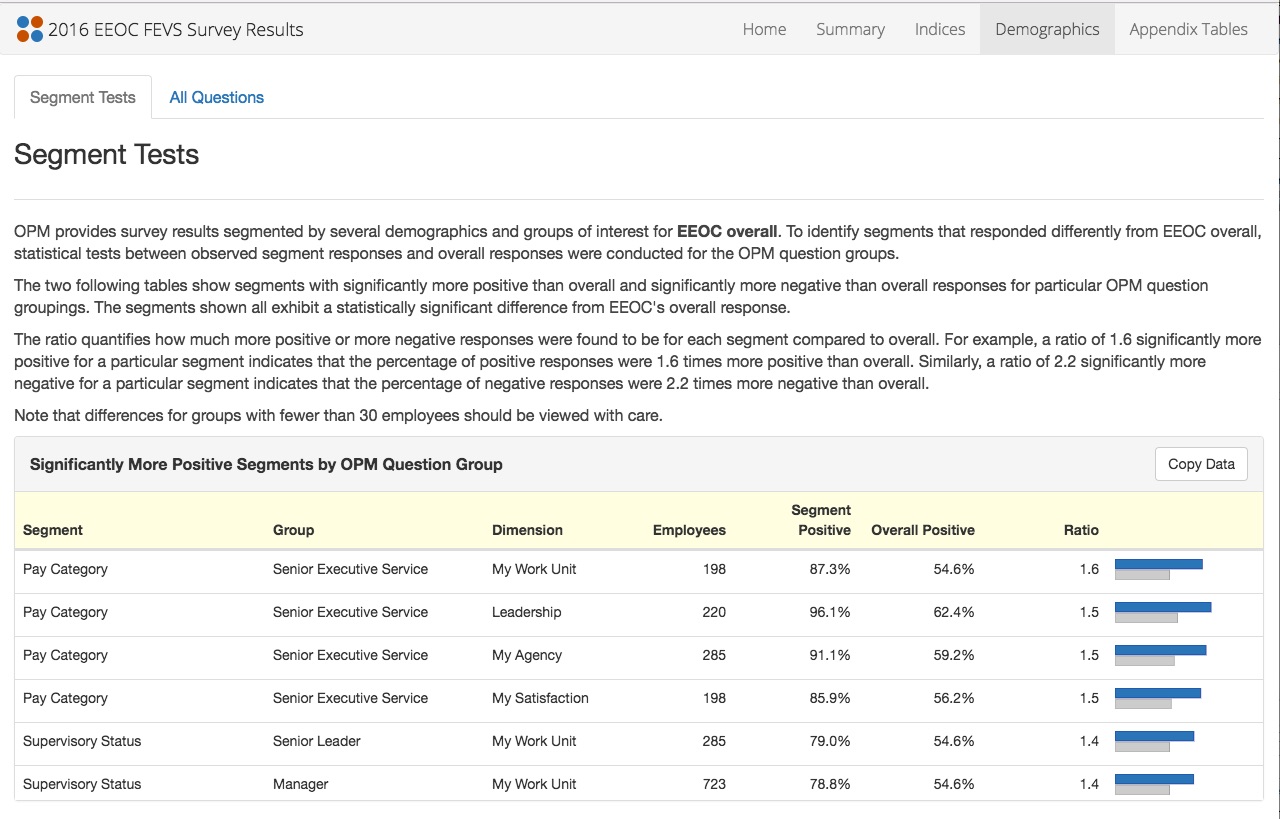
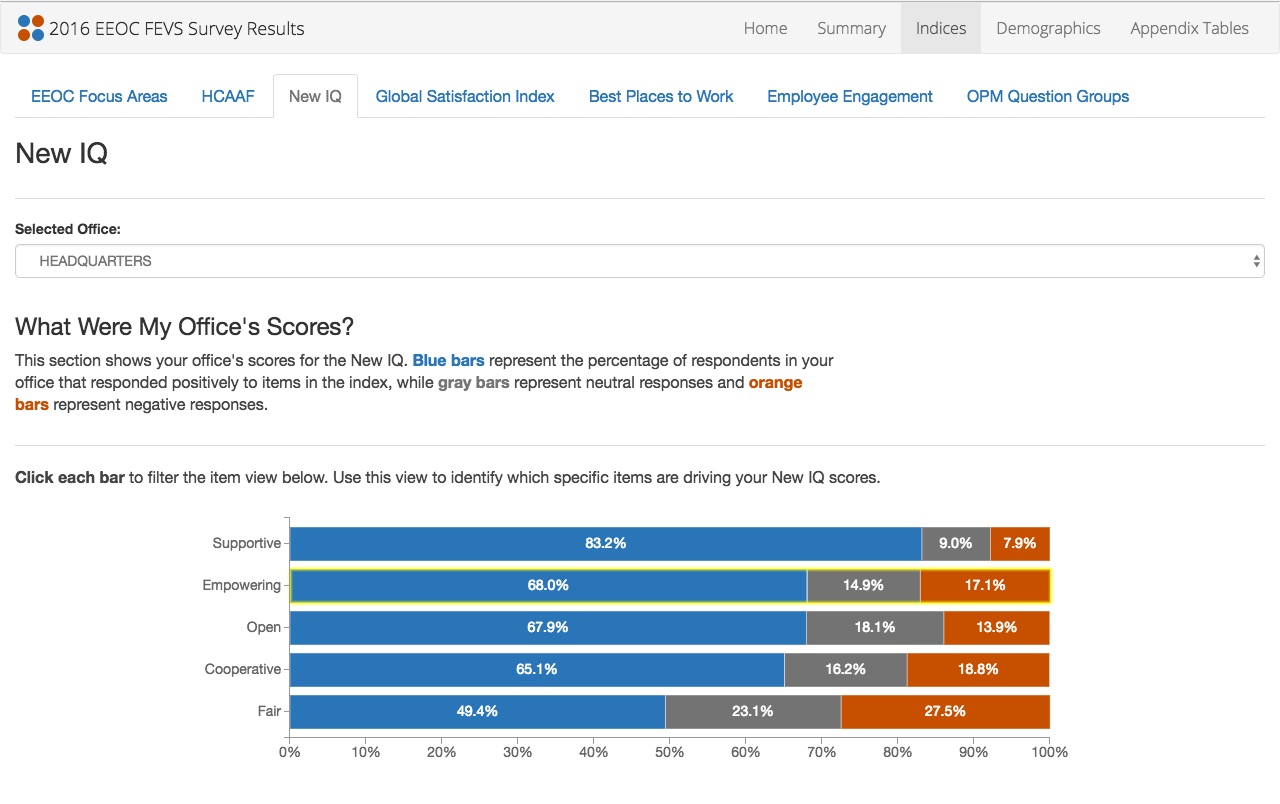
FEVS Survey Reporting
Results and analysis reporting for the Federal Employee Viewpoint Survey. Built to replace and enhance an inaccessible Tableau dashboard.
Rails, Vue.js, SVG, PostgreSQL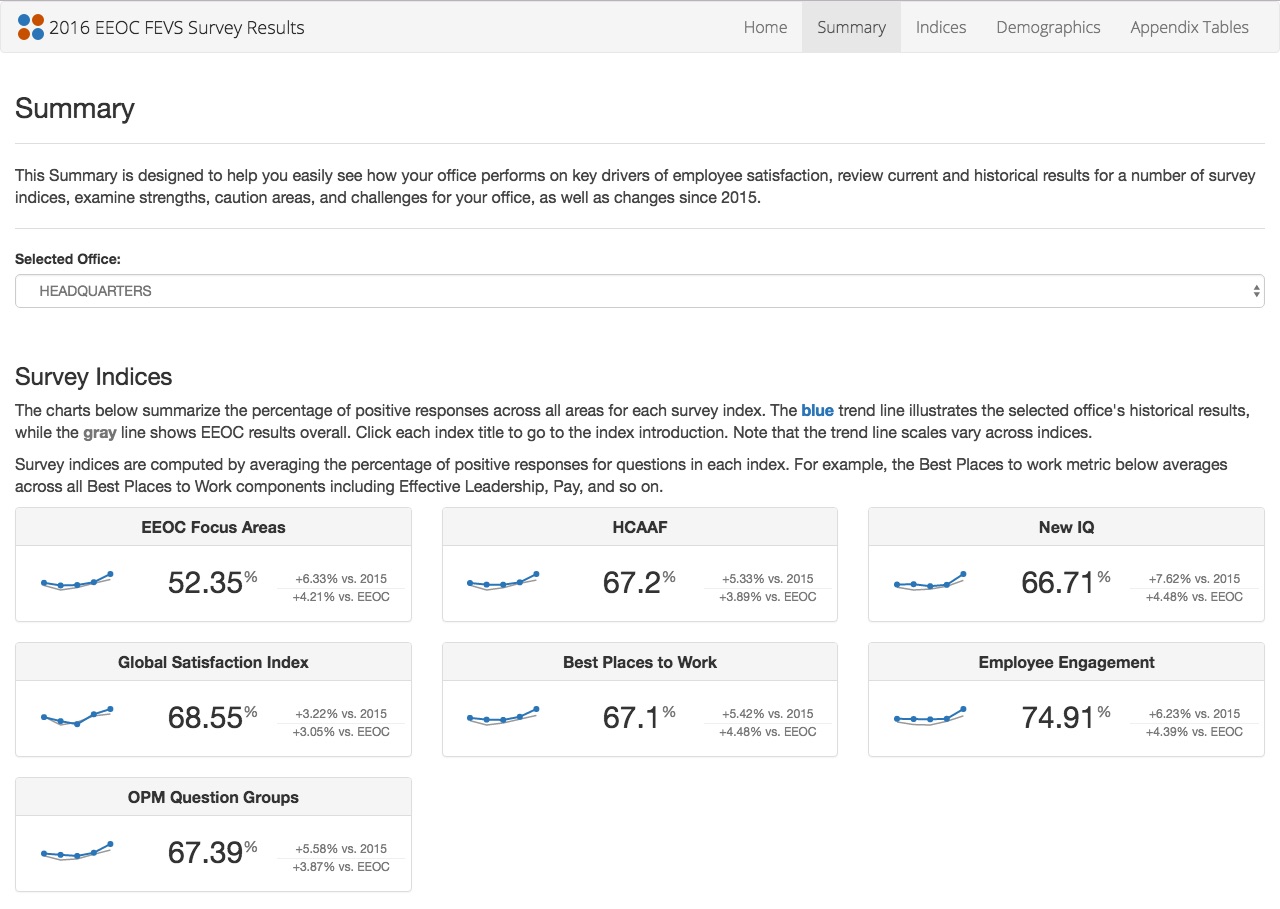
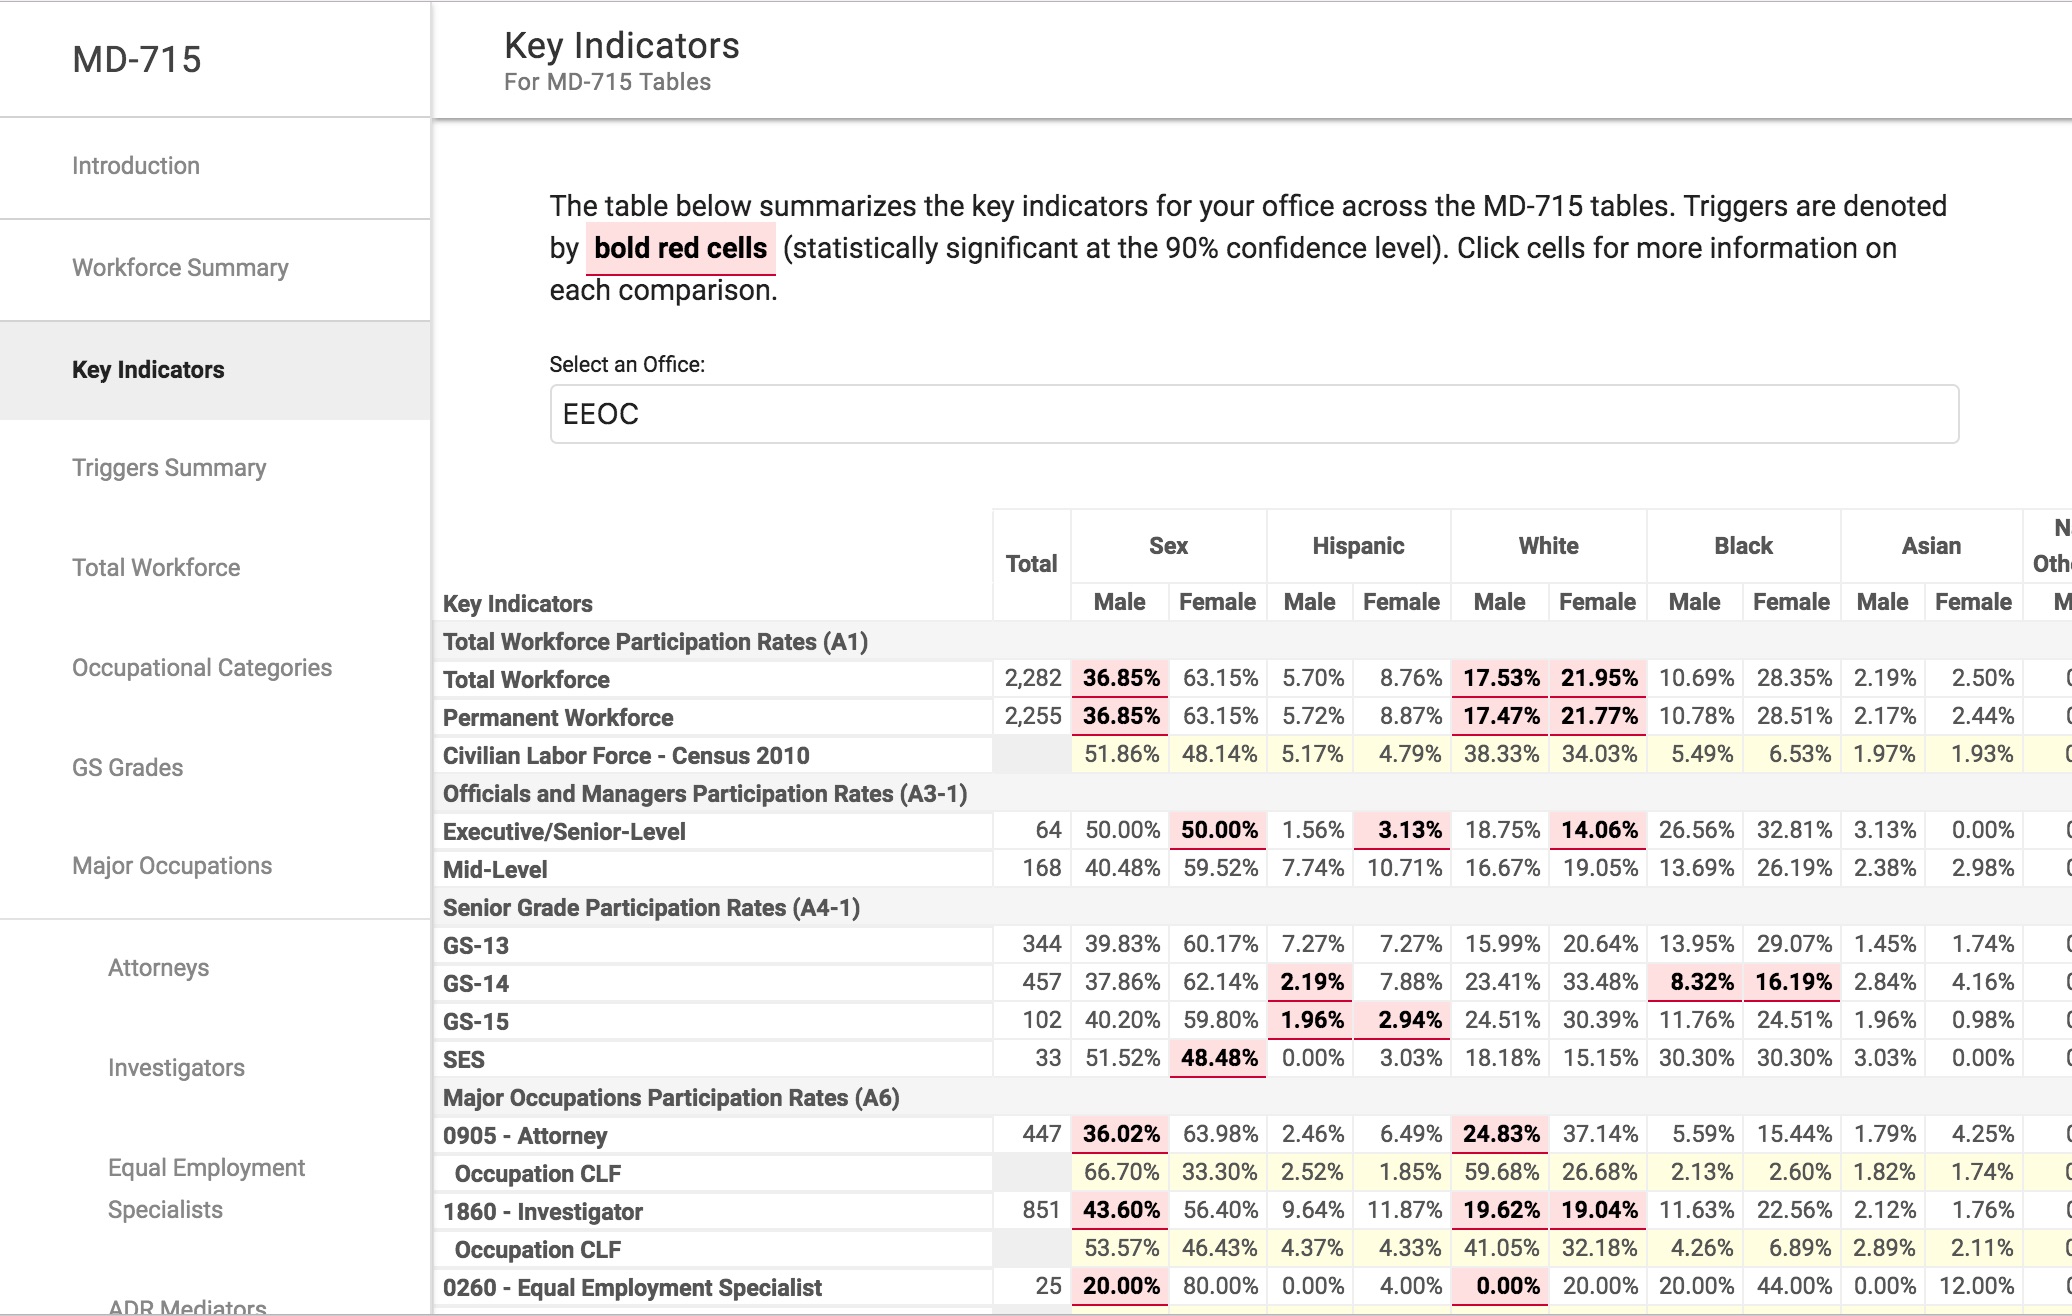
MD-715 Analysis
Automated statistical analyses and visualization of workforce diversity for federal agencies. Conducts binomial distribution tests again U.S. Census data to determine the probability that the onboard workforce is representative of occupational labor force.
Rails, Vue.js, SVG, PostgreSQL, R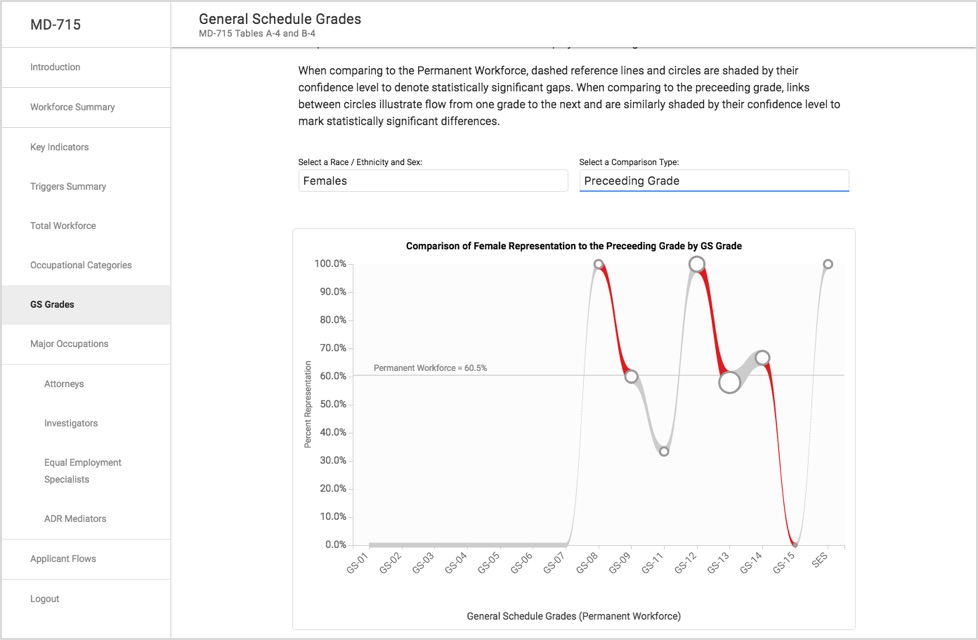
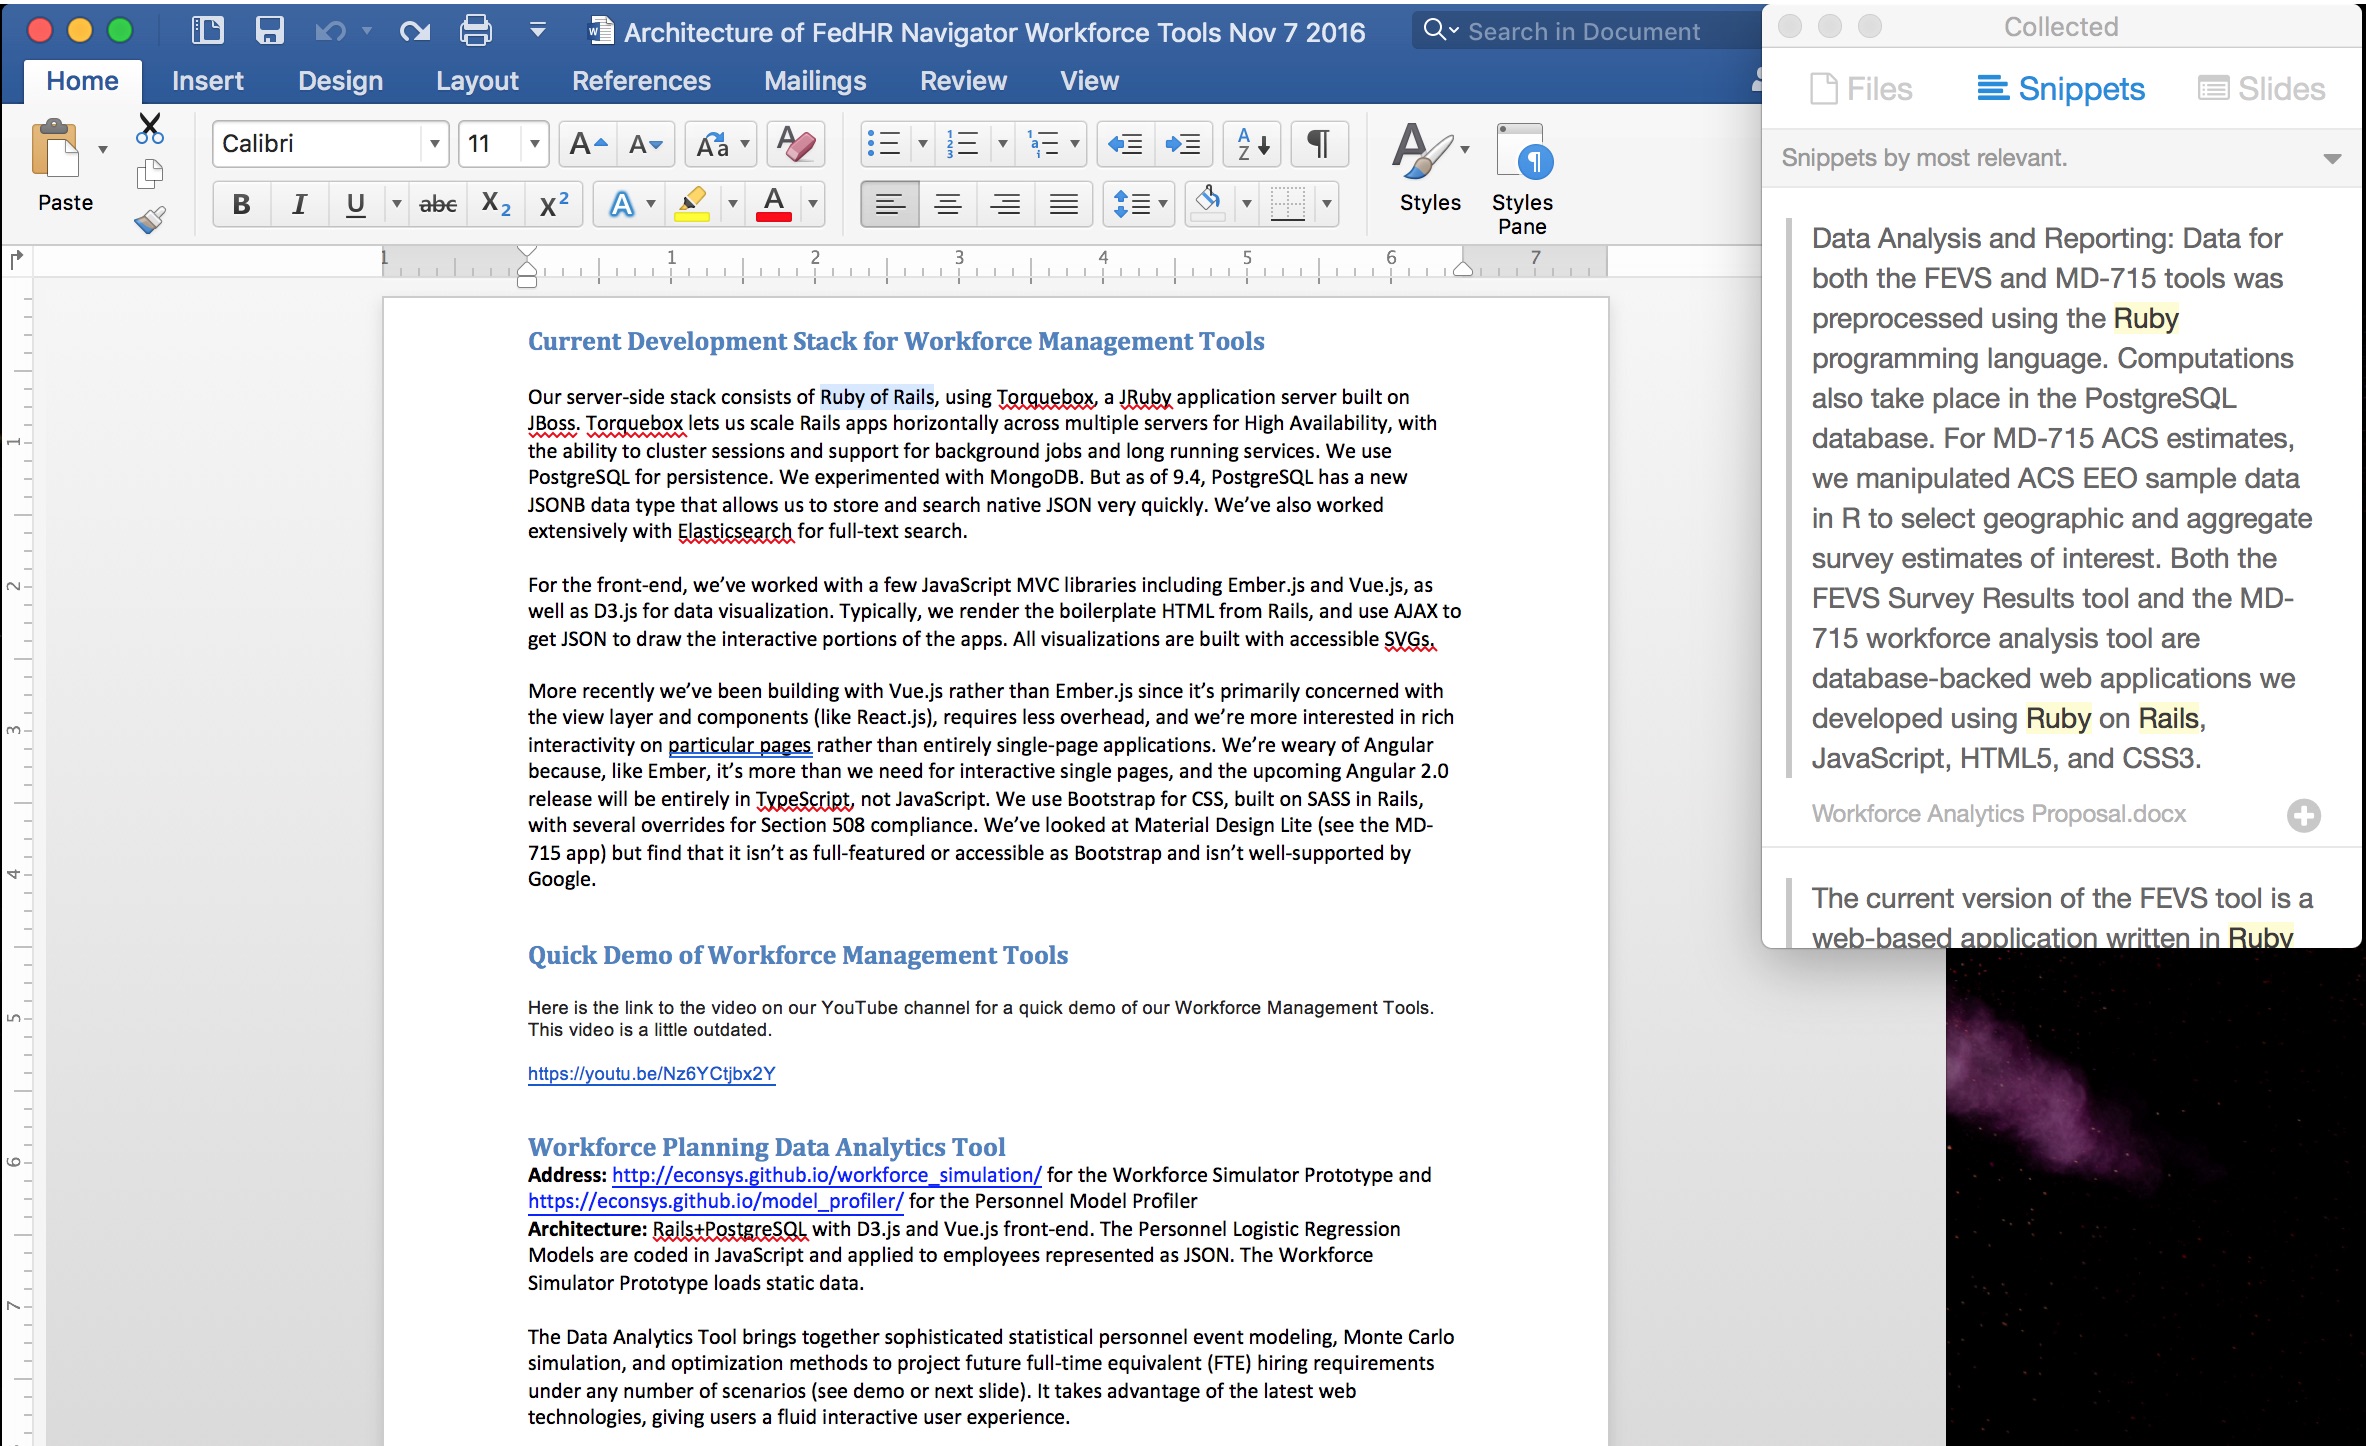
Collected
Real-time content suggestion in Microsoft Office making your word processor aware of all your work. Uses NLP to suggests related snippets of content and slides from your other files as you work. Includes apps for Windows, Mac, and the web. Connects with Google Drive, Dropbox, Box, OneDrive, Salesforce, and Sharepoint.
OpenNLP, Rails, Ember.js, PostgreSQL, Elasticsearch, Objective C, C#, JMP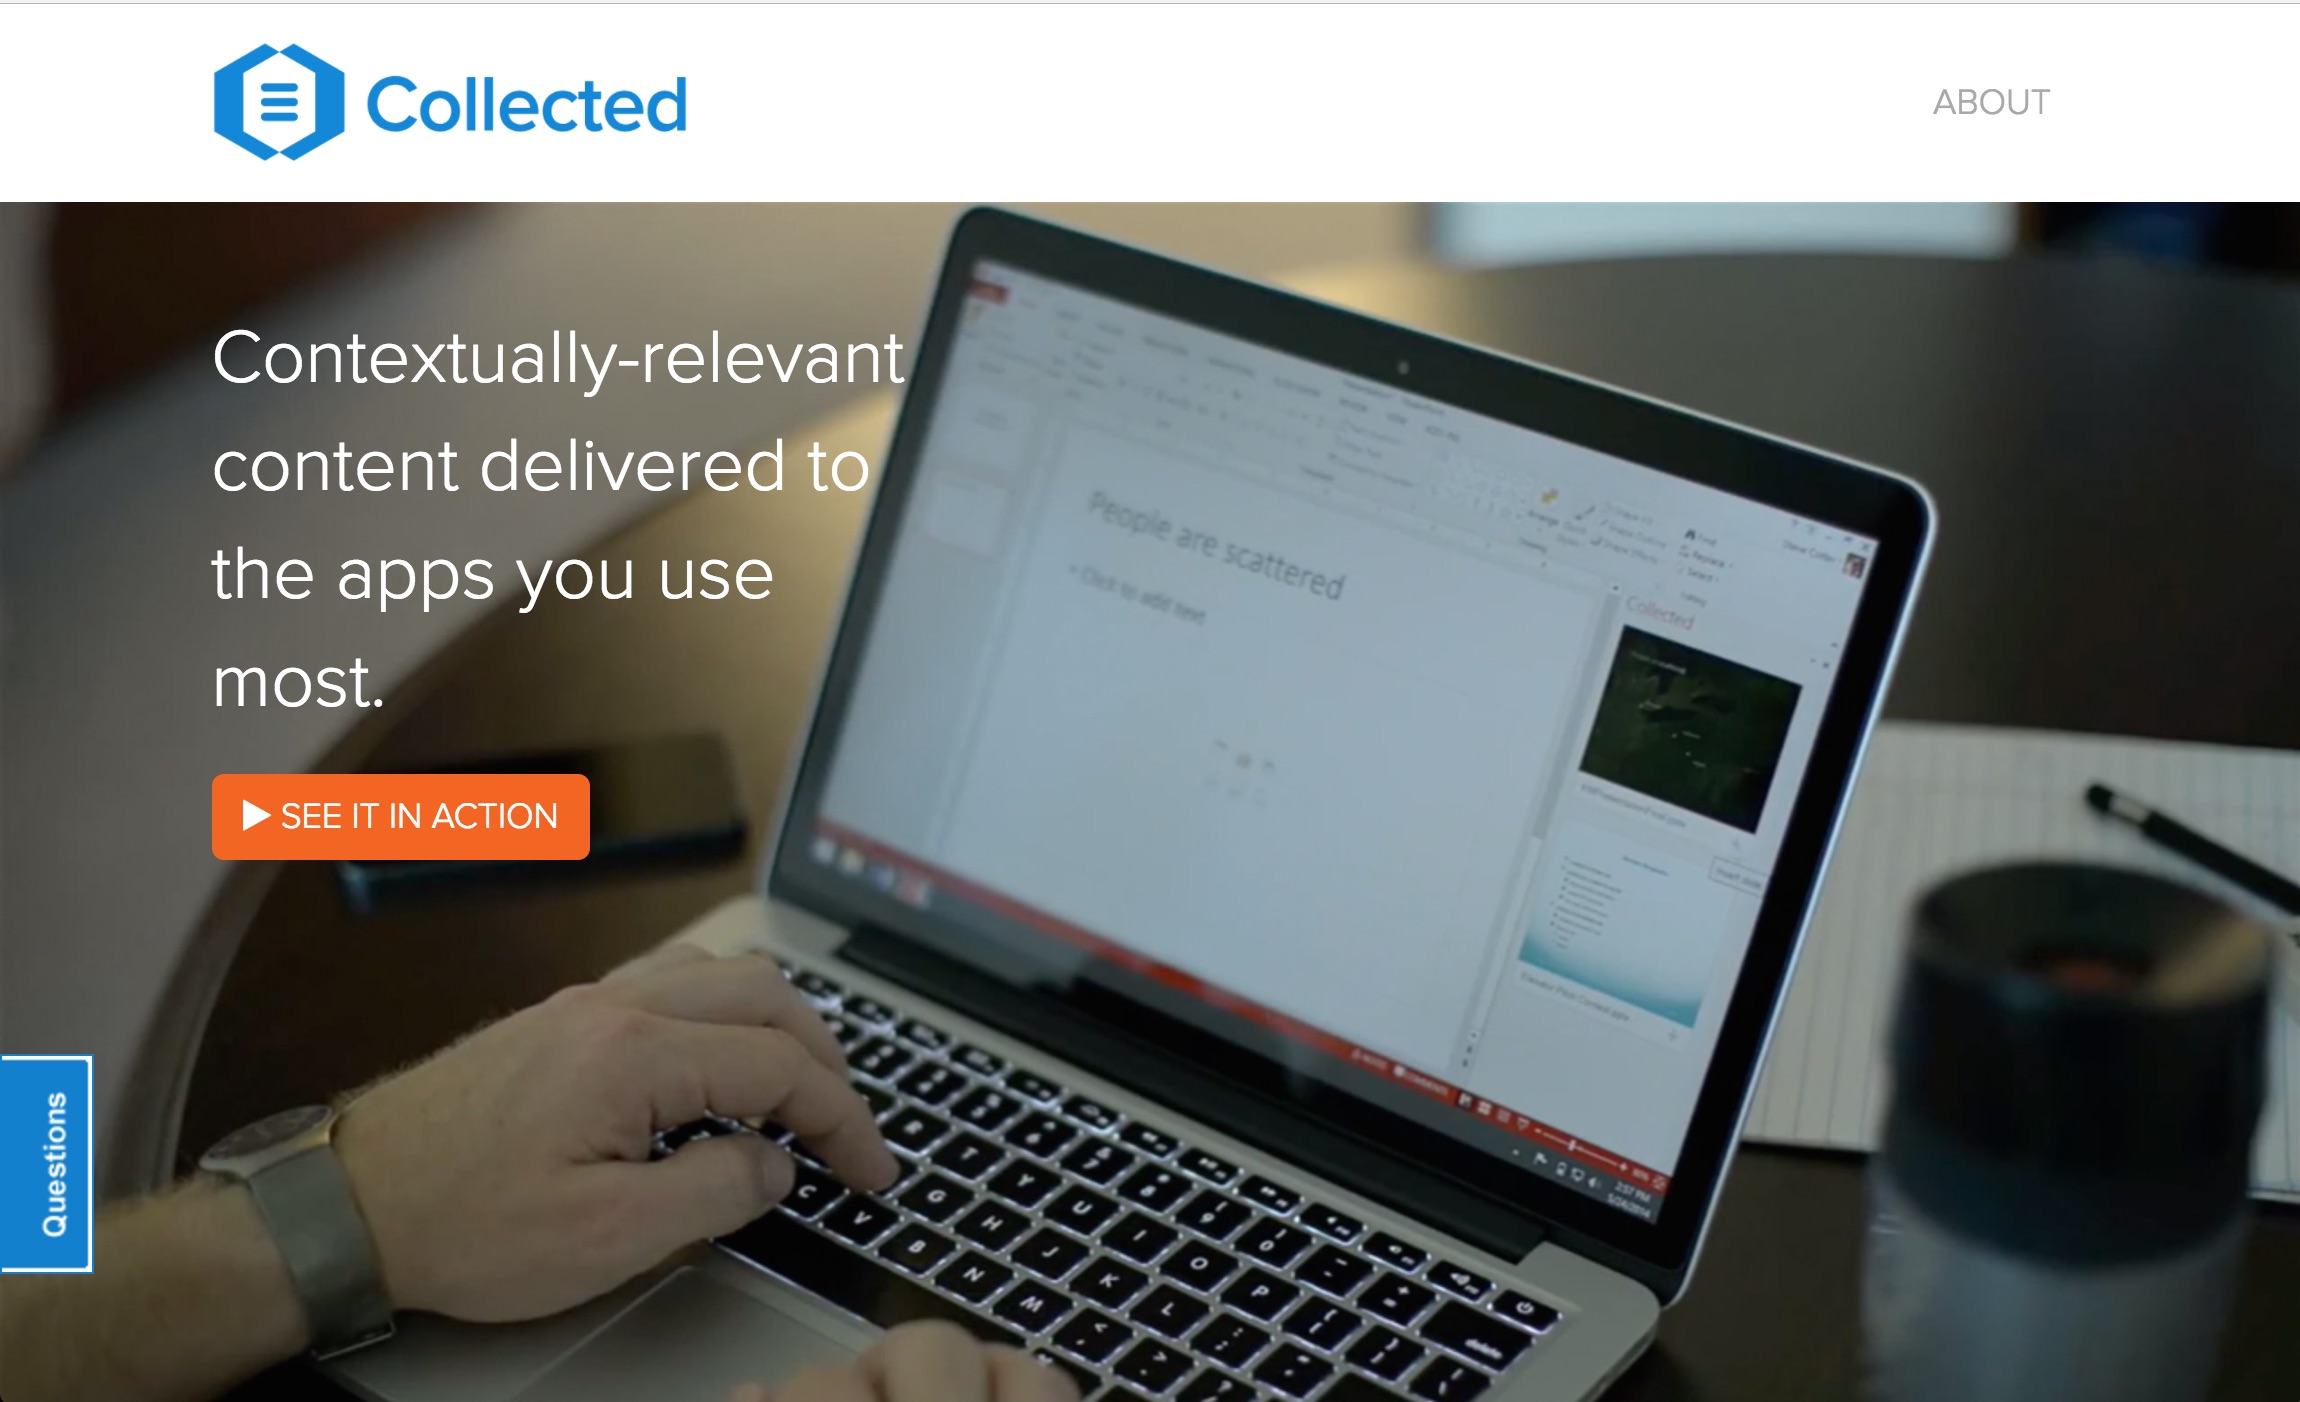
Identifying Better Jobs for Low-Wage Immigrant Women Workers
Data visualization of better paying jobs for low-wage immigrant working women by clustering O*Net skills data.
D3.js, SVG, R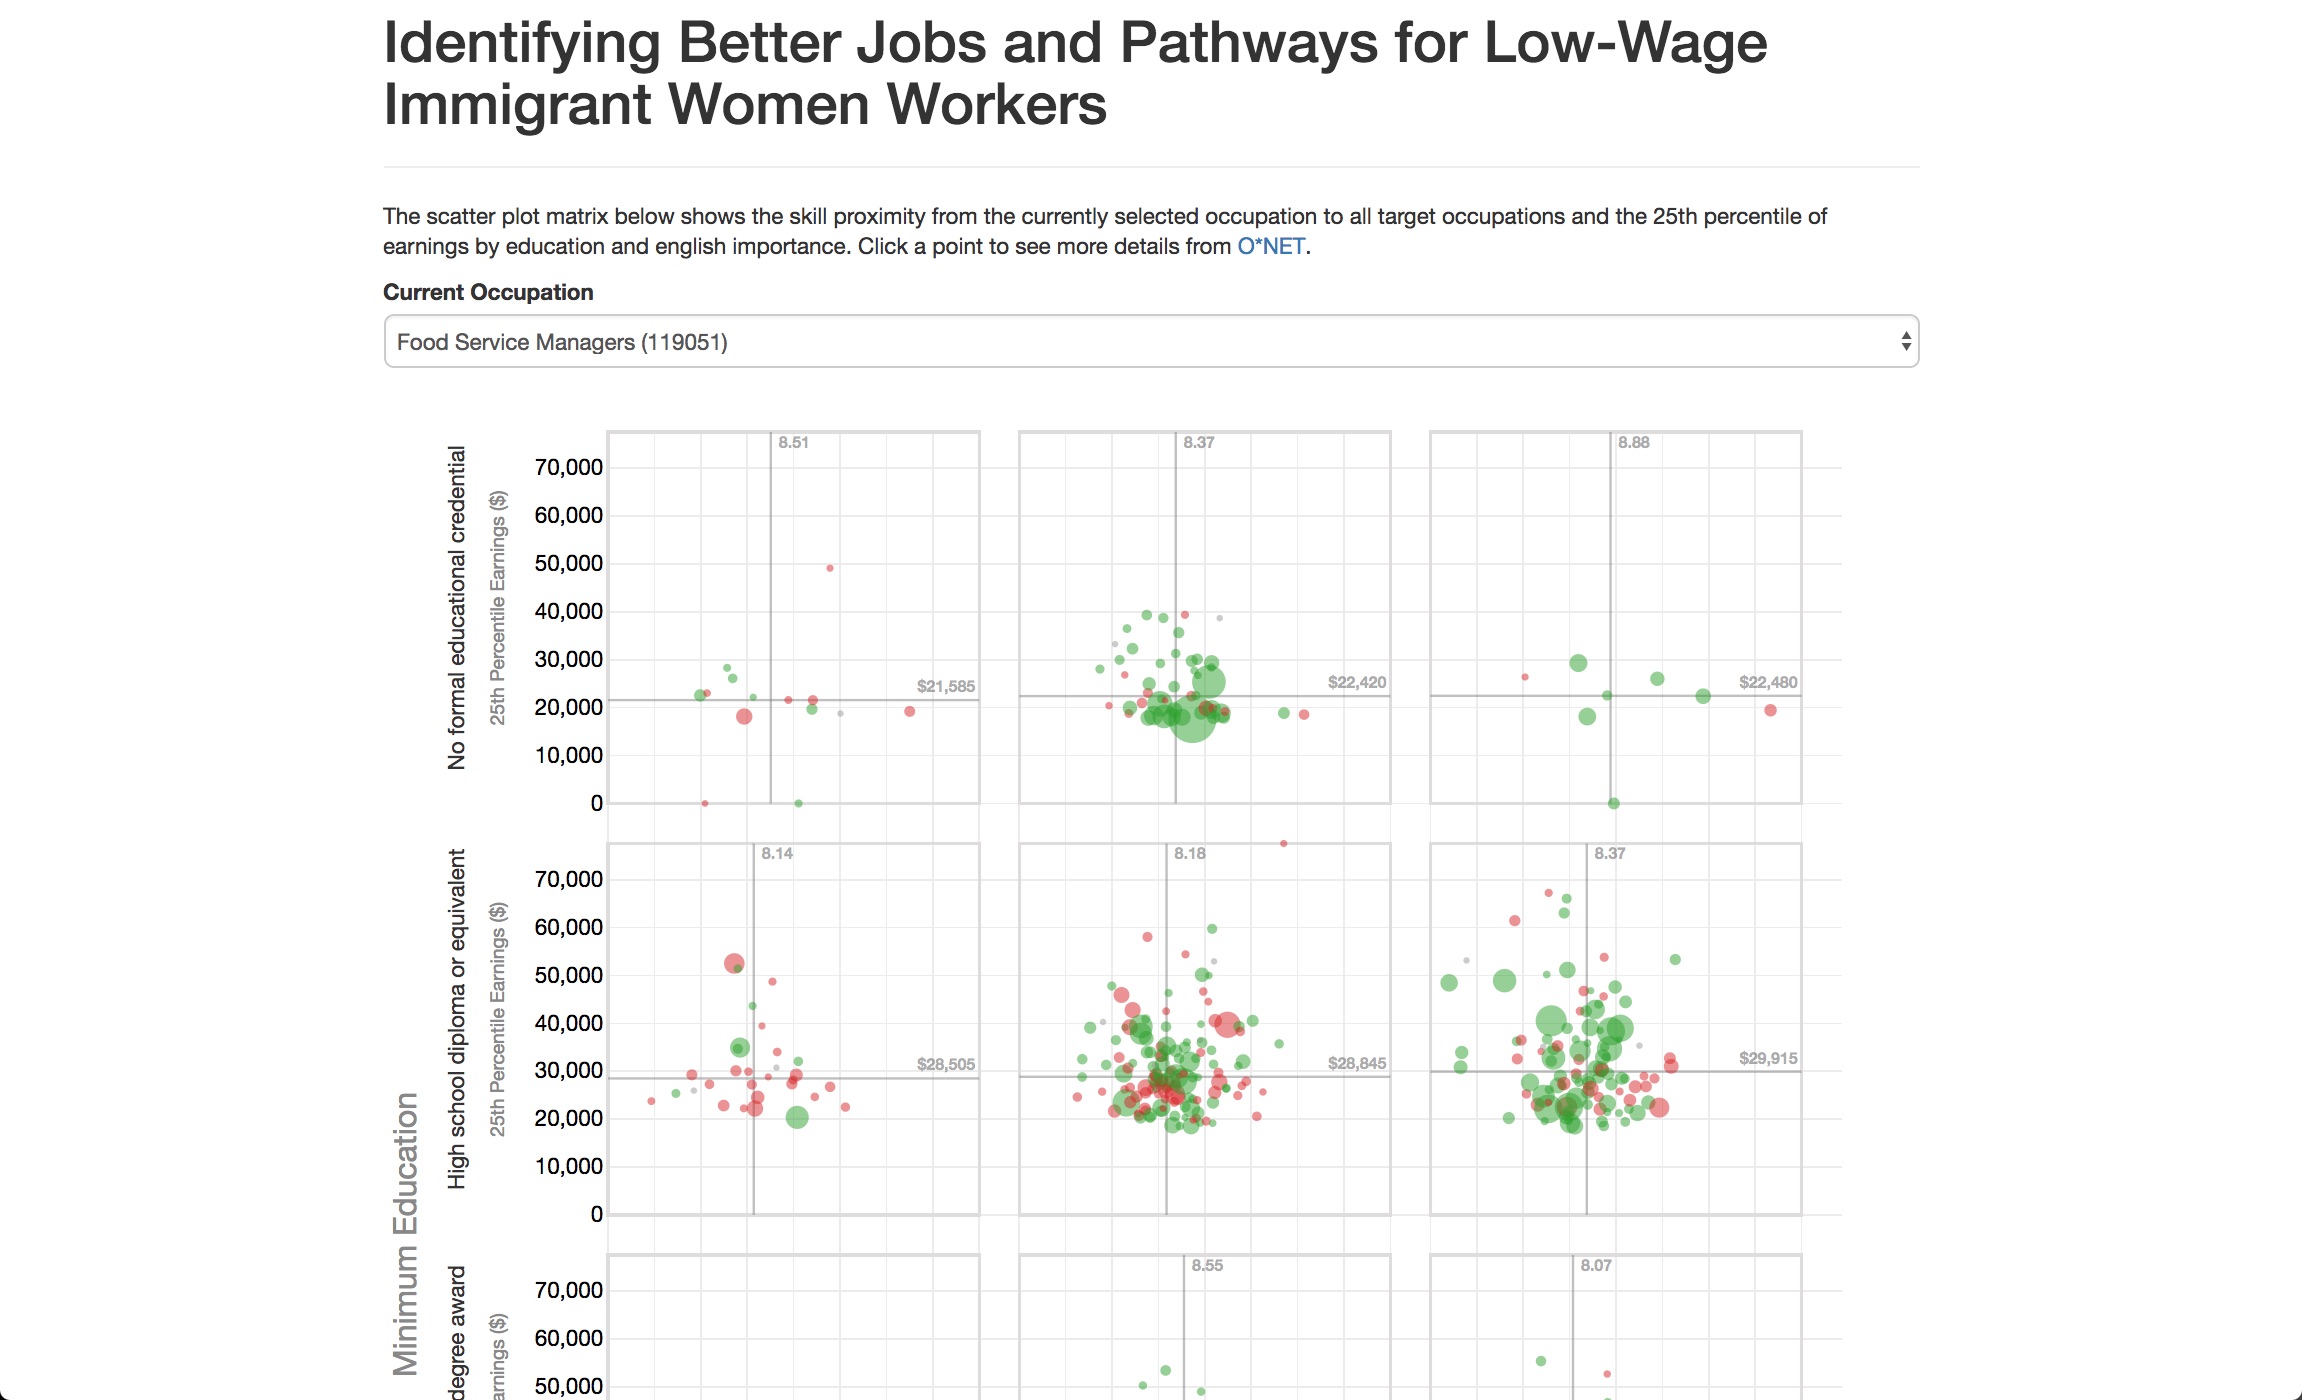
Workforce Simulation
Browser-based simulation modeling of personnel events using logistic regression and optimization.
Cobyla.js, Vue.js, D3.js, R, JMP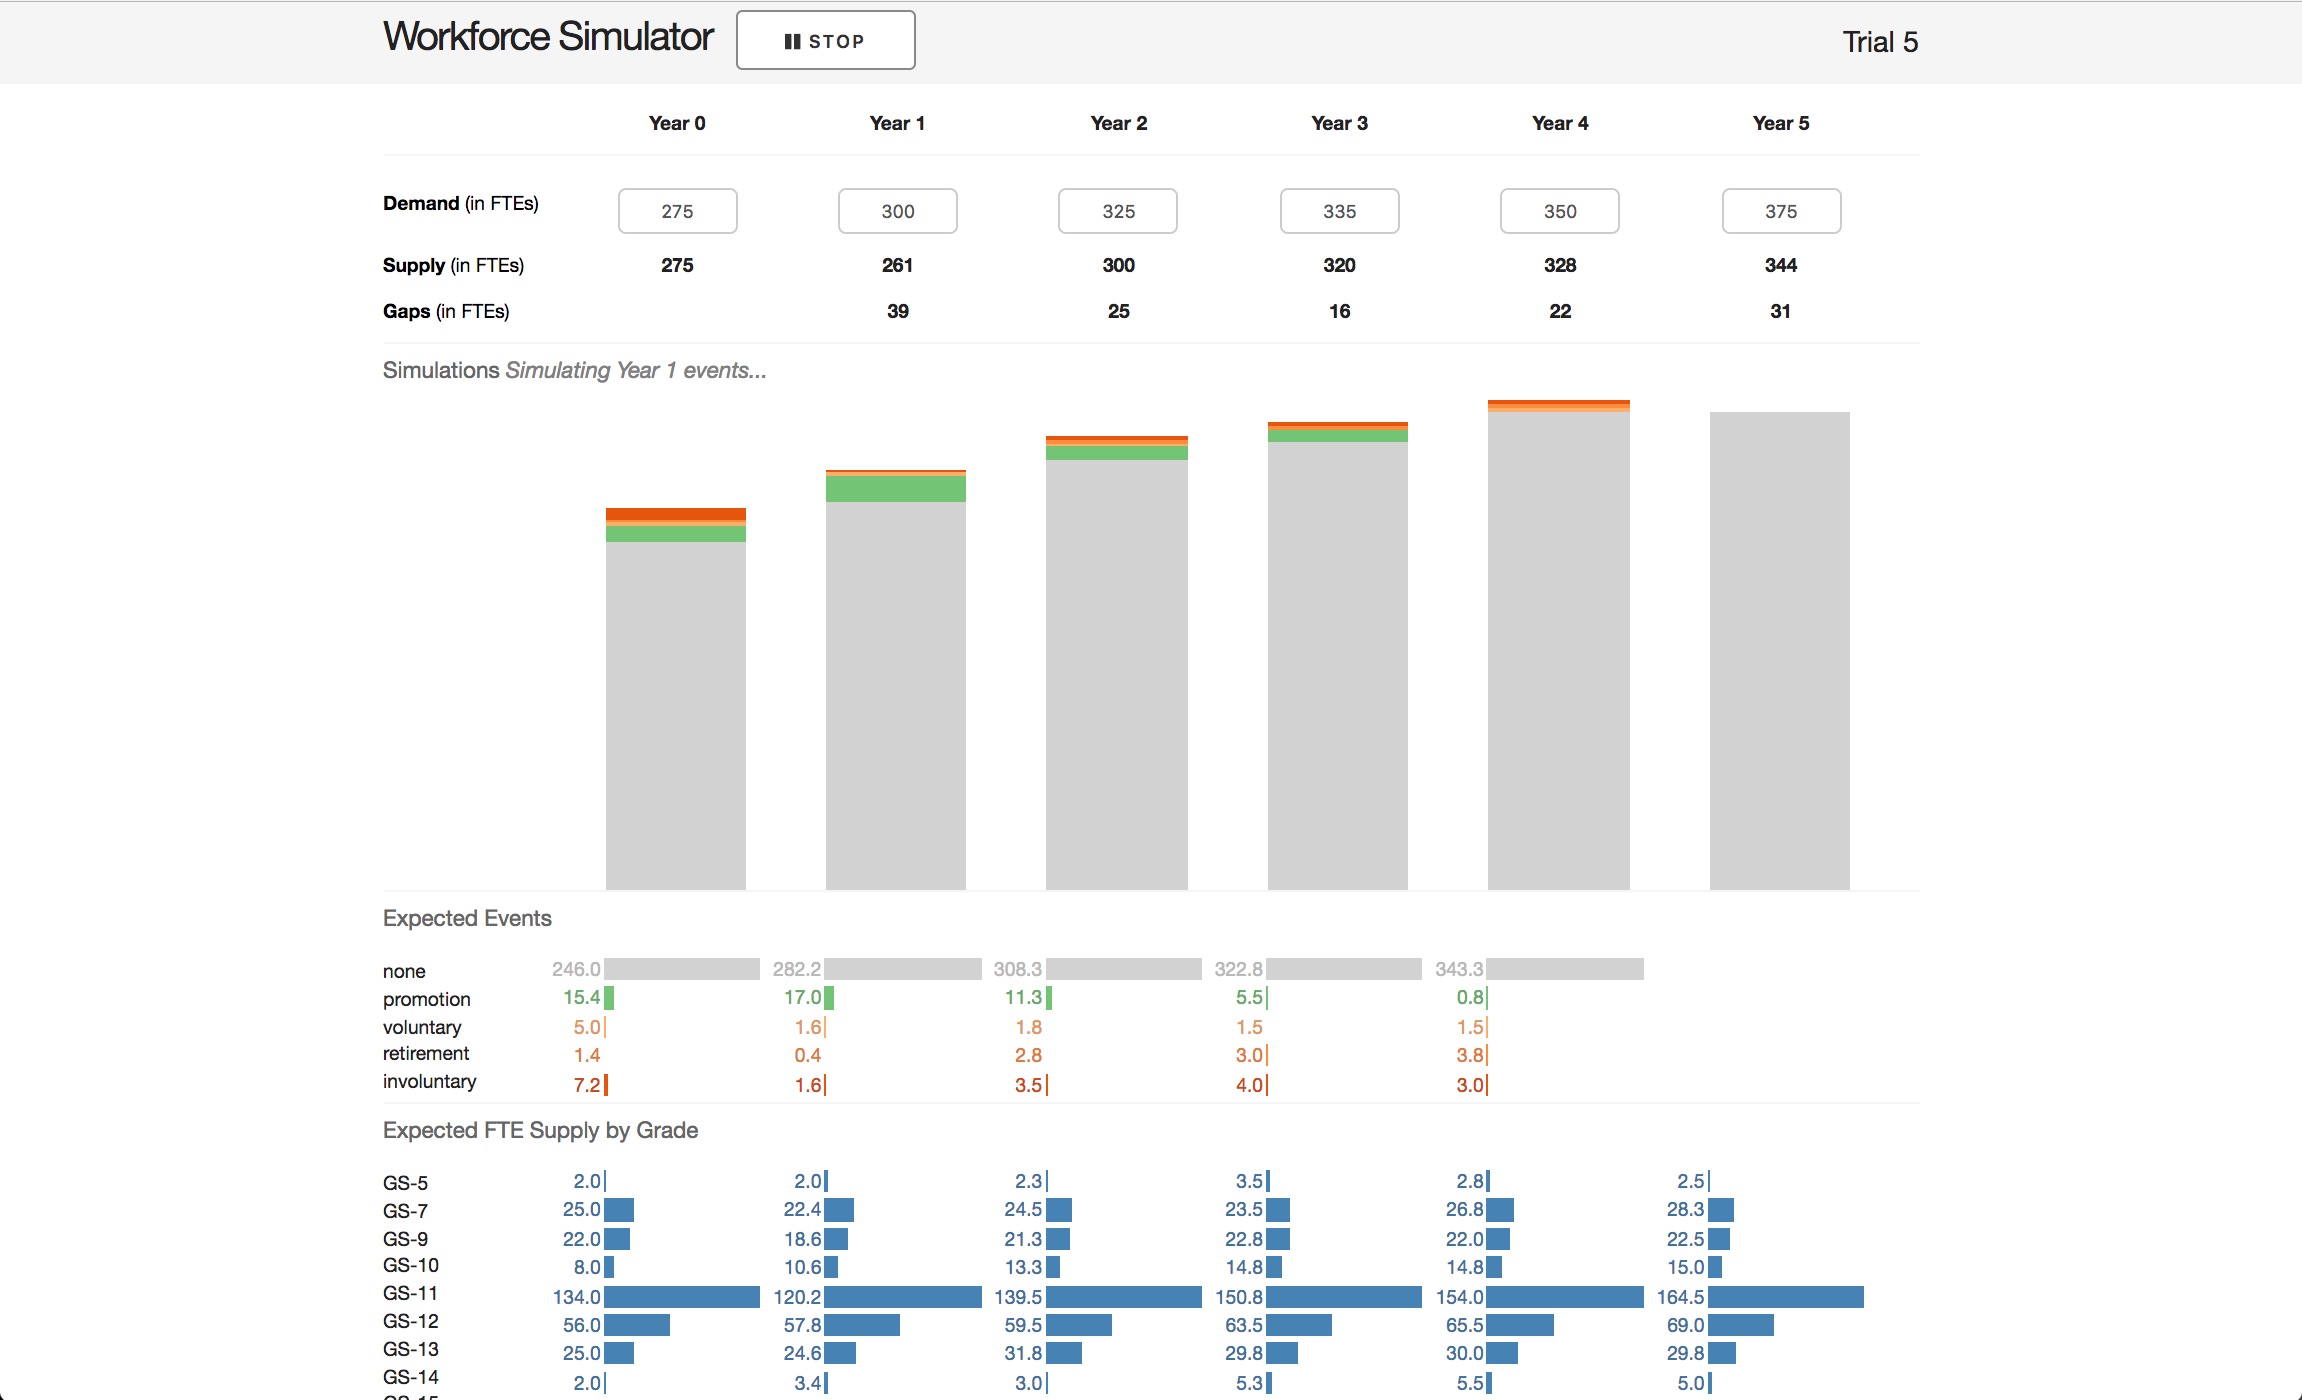
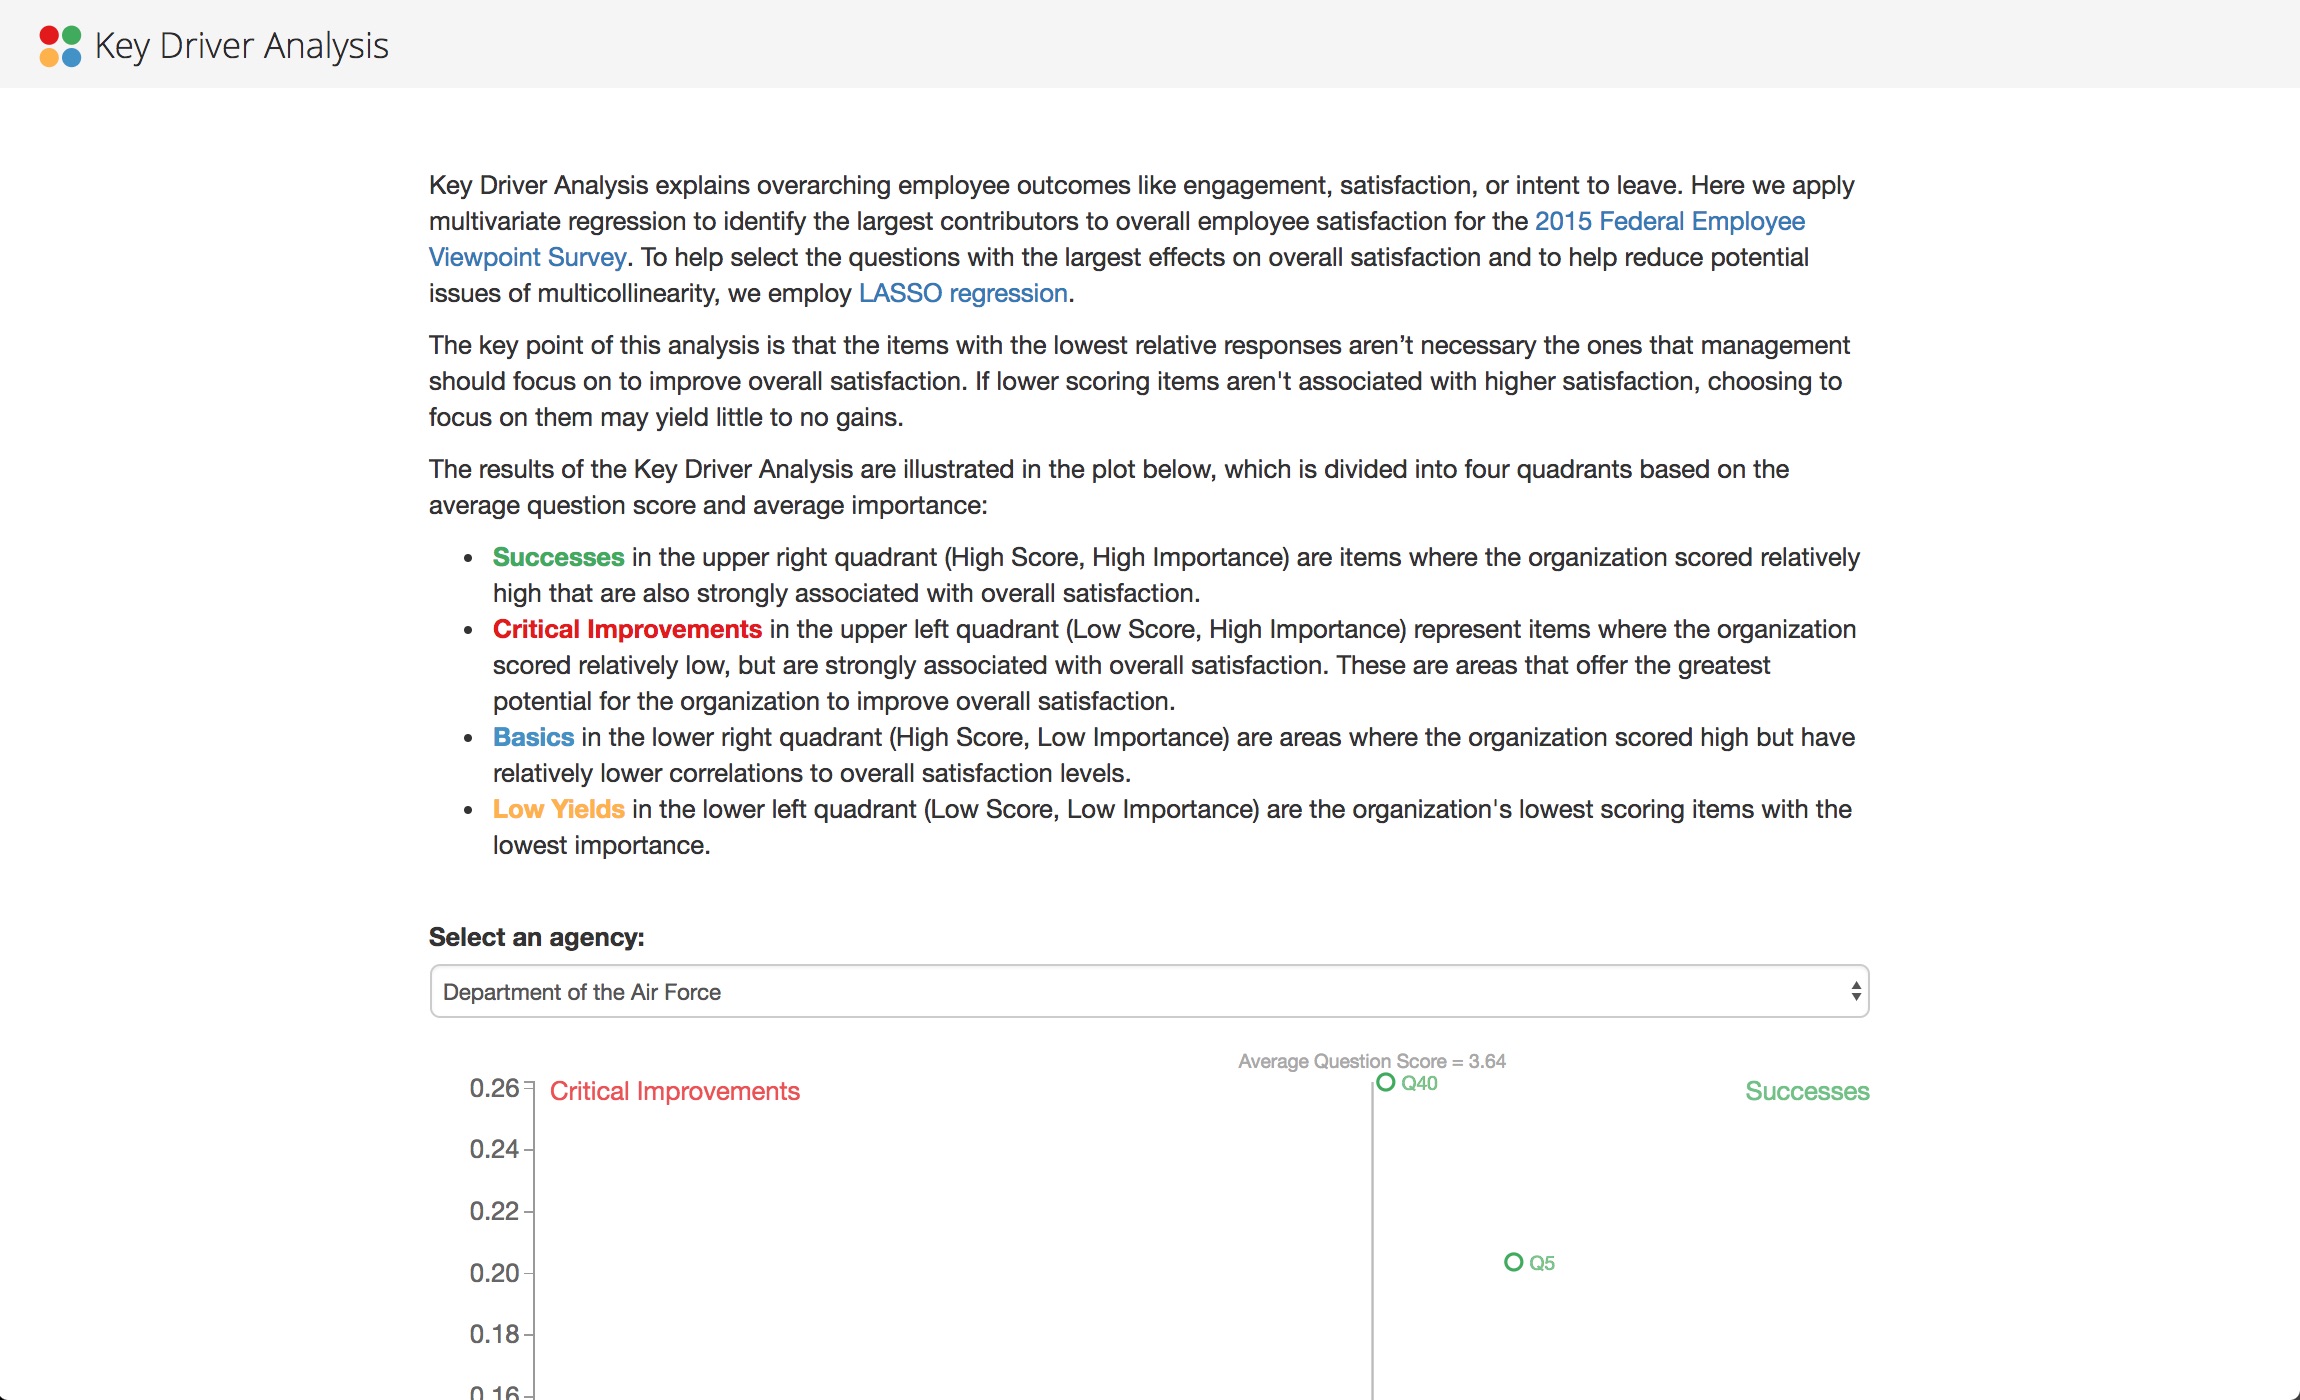
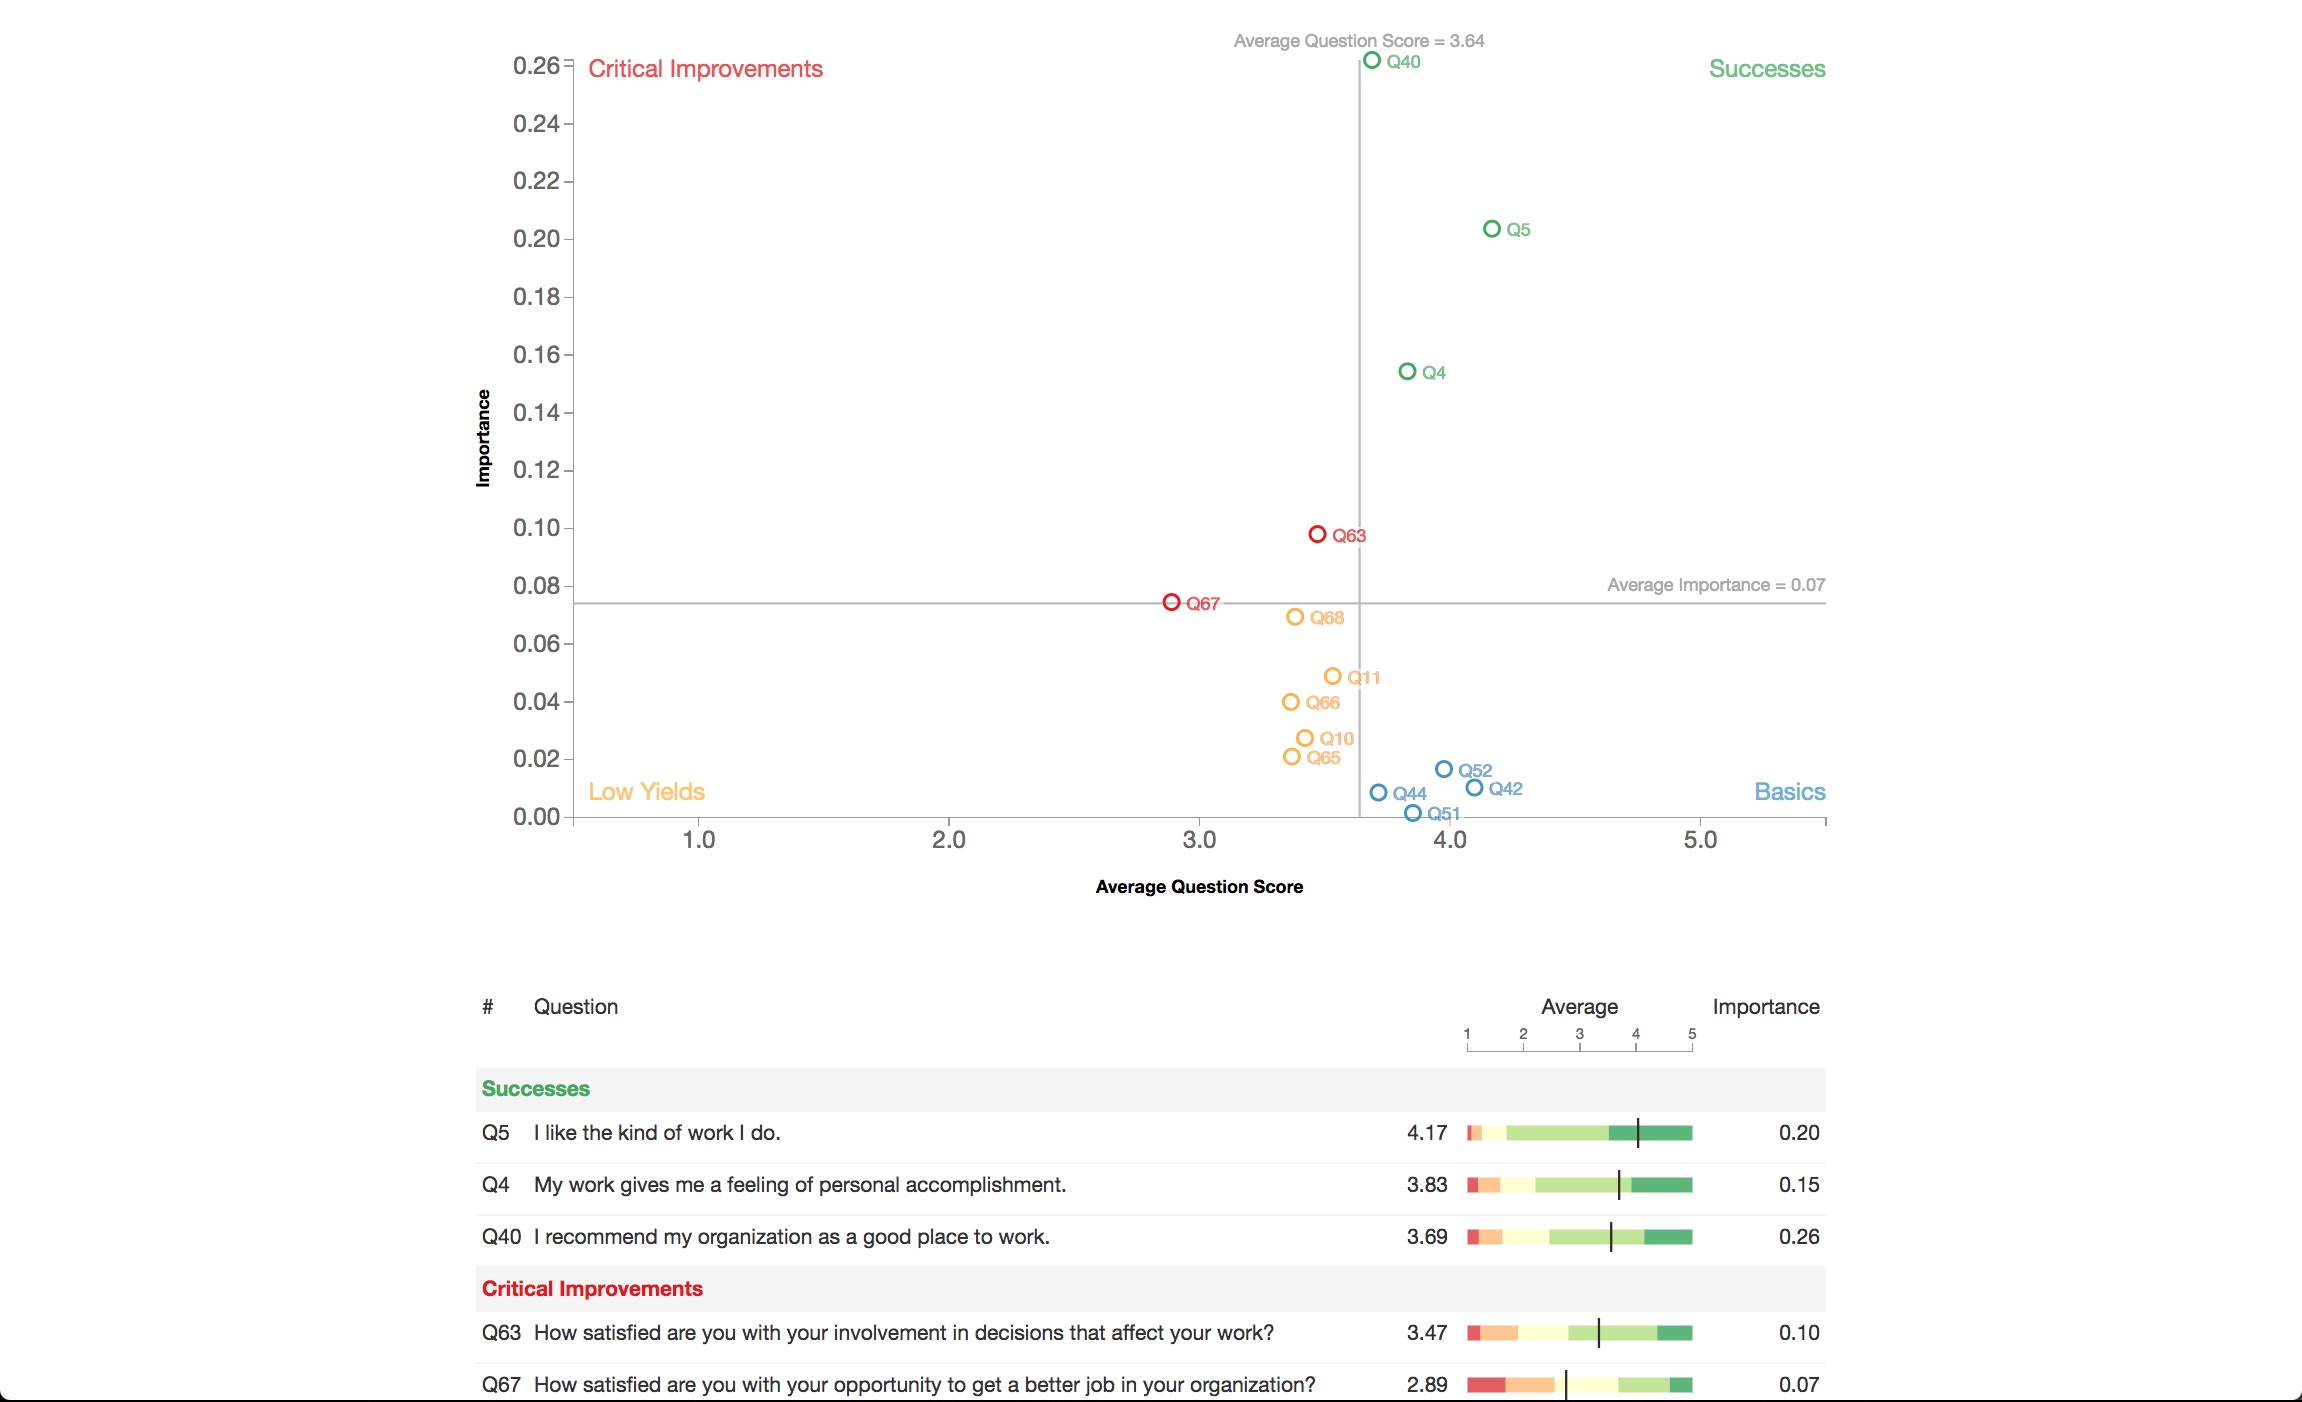
Key Drivers - FEVS
Analysis of the Key Drivers of employee satisfaction for federal agencies using LASSO regression.
D3.js, SVG, R